
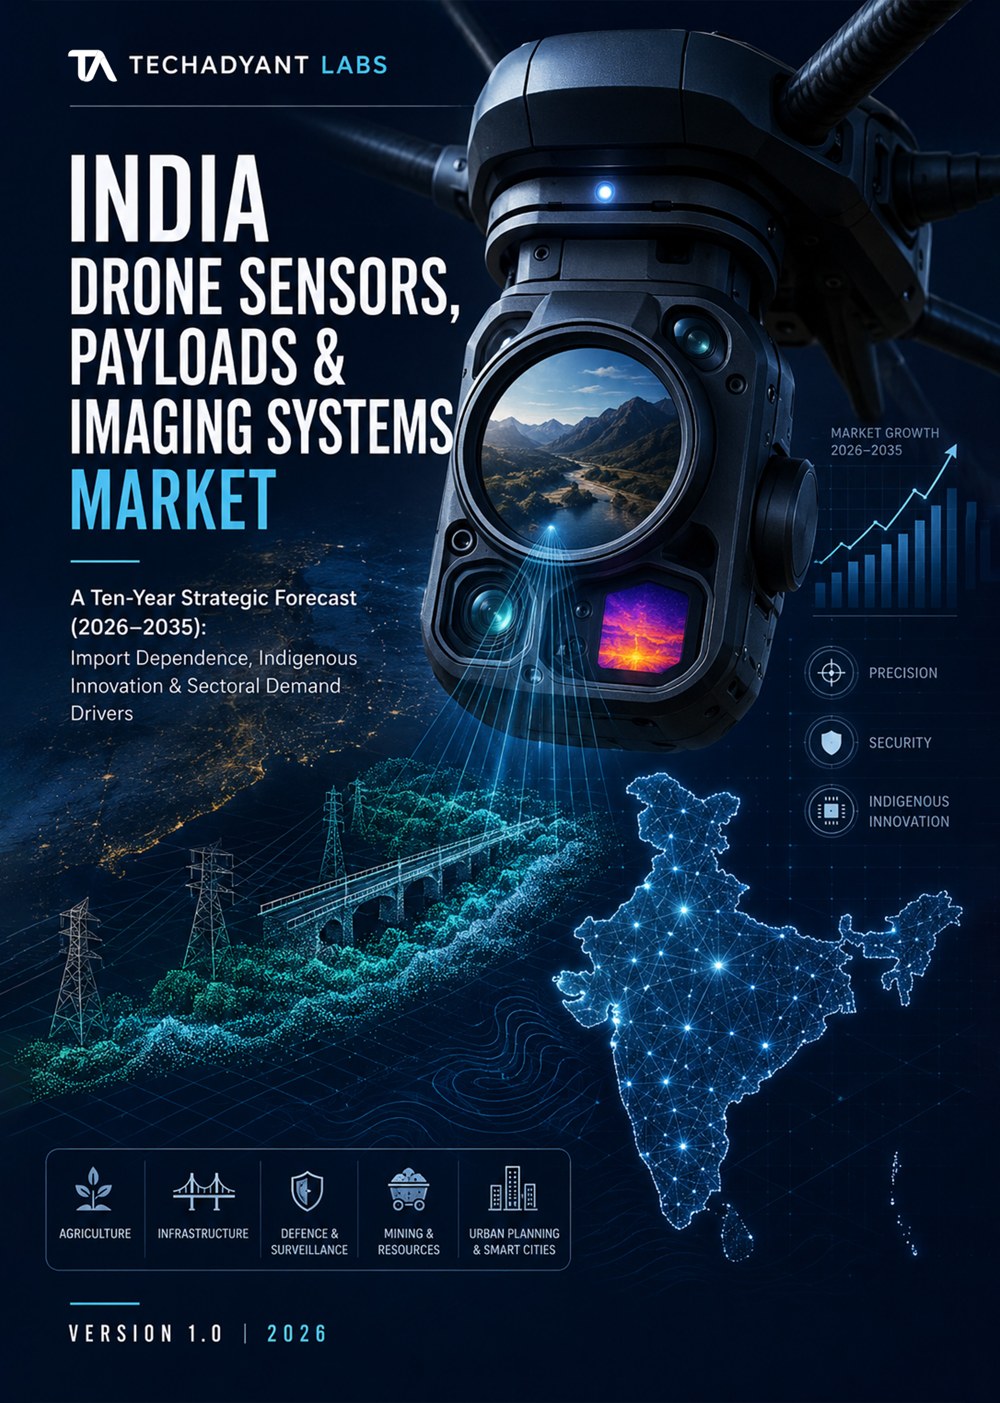
A drone is only as capable as what it can sense, and India imports most of that capability. The country can increasingly build airframes, autopilots and ground stations, but the sensors that turn a drone into a useful instrument remain overwhelmingly imported. This report sizes that sensing layer, traces where the dependency sits, and maps where domestic value can be captured.
- Between 70% and 80% of high-grade drone-sensor demand is met by imports, with the most valuable categories the most import-bound.
- LiDAR is about 85% imported, thermal imaging about 80%, and inertial measurement units about 70%, sourced mainly from China, Taiwan and the United States.
- The market is valued at roughly US$190–210 million in 2026 and modelled to reach US$1.1–1.5 billion by 2035 at a 22–26% CAGR.
- Indigenous alternatives such as Eon Space Labs’ germanium-free thermal imaging show that import dependence can be engineered around, not just replicated.
- Value is migrating from hardware to Drone-as-a-Service and data monetisation, making sensor fusion and AI-enabled edge processing non-negotiable.
The sensing layer is the dependency
A drone is only as capable as what it can sense. India’s drone story is usually told through platforms and assembly, but the strategic exposure lives one layer up, in the payload. Between 70% and 80% of high-grade drone-sensor demand is met by imports, and the most valuable categories — survey-grade LiDAR and cooled thermal cores — are the most import-bound of all. The result is an ecosystem that can build the aircraft but must buy its eyes, and pay import premiums of 20–40% and lead times measured in months to do so.
A US$1.5bn market by 2035
The market for drone sensors, payloads and imaging systems is valued at roughly US$190–210 million in 2026 and is modelled to reach US$1.1–1.5 billion by 2035, a compound growth rate of 22–26%. Three structural shifts underpin the curve: the transition from imported components toward indigenous manufacturing under the PLI scheme, the consolidation of discrete sensors into integrated payload solutions, and the monetisation of data rather than hardware.

Imported eyes
The dependency is not uniform — it concentrates in exactly the categories that matter most. LiDAR is about 85% imported, thermal imaging about 80%, inertial measurement units about 70%. China, Taiwan and the United States supply the bulk. The 2024 germanium crisis, which sent thermal-optics lead times to seven months and costs up tenfold, showed how a single upstream material can hold an entire payload category hostage.

Where the demand sits
Commercial end-use sectors — agriculture, infrastructure, mining and logistics — account for 55–60% of sensor demand, ahead of defence at 25–30% and consumer at 10–15%. Agriculture alone is roughly a fifth of commercial demand. LiDAR is the fastest growing category at over 35% CAGR, pulled by infrastructure inspection, mining volumetrics and corridor mapping. The report segments the market five ways — by sensor type, end-use sector, UAV class, component tier and region — and identifies the high-growth cells where demand and localisation potential overlap.

Engineering around the chokepoint
The most important finding in the report is that import dependence can be engineered around, not just replicated. Eon Space Labs’ germanium-free thermal imaging avoids the very material whose supply crisis exposed the category, lowering system cost by 60–70% while reaching roughly 80% local manufacturing. It is proof that the right architectural choice can convert a chokepoint into an opportunity surface — and a template for the LiDAR, IMU and multispectral categories that follow.
From hardware to data
Value is migrating from the sensor to the data it captures. Drone-as-a-Service has become the dominant model, with margins of 50–65% against 25–35% for hardware. Enterprise buyers increasingly want actionable intelligence — orthomosaics, point clouds, NDVI layers — rather than raw sensors, which makes sensor fusion and AI-enabled edge processing non-negotiable, and shifts the competitive battleground from optics to software.

Who leads
ideaForge leads on certification and integrated payload ecosystems; Eon Space Labs holds proprietary germanium-free thermal with about 80% localisation; Garuda Aerospace runs the largest agricultural DaaS fleet; BEL brings defence-PSU radar depth. International suppliers still own the high-spec LiDAR and cooled thermal cores. The competitive question for the next three years is whether configurability and indigenous payloads can outflank superior imported specifications on price, lead time and PLI eligibility.

Three phases to 2035
Growth will not be linear. The report models three phases: certification-led growth (2026–2028), as DGCA type certifications unlock enterprise procurement; indigenous scaling (2029–2032), as domestic thermal, LiDAR and IMU alternatives reach commercial scale and import dependence falls from ~75% toward 55–60%; and export and maturity (2033–2035), as Indian sensor-integrated payloads turn cost-competitive abroad and exports reach 15–20% of leading players’ revenue.

What the full report adds
The full ~143-page edition carries the complete market model: thirteen chapters, fifty figures and 137 tables. It includes the full five-way segmentation with sizing for every cell, the 2021–2035 forecast with scenario analysis and ASP trends, the regulatory and PLI deep dive, the supply-chain and import-dependence mapping with the Eon Space Labs case study and a localisation roadmap, a technology and TRL assessment of every sensor class, detailed company profiles and market-share analysis, end-use sector economics, business-model and monetisation analysis, and a closing investment and strategic-recommendation chapter for OEMs, sensor manufacturers, investors and policymakers.
Unlock the complete report
You’re reading the free preview. The full analysis continues with six more sections and the downloadable PDF edition.
- 🔒04 · Water, power & land
- 🔒05 · The packaging layer
- 🔒06 · Who captures the value
- 🔒07 · The talent constraint
- 🔒08 · Second-order effects
- 🔒09 · What to watch · references
You’ll be asked to sign in, then complete a one-time secure purchase.