
Long-form strategic research
Decision-grade research for the people shaping India’s strategic industries — policymakers, defence and manufacturing leaders, investors and technology executives. Each report takes a single strategic question and works it through the dependencies, constraints and beneficiaries that determine the real outcome.
Most analysis tells you what is happening. These reports tell you what it means for a decision you have to make — what to build, fund, source, localise or guard against.
See it early
Identify emerging industrial opportunities before they become consensus — and before the capital and policy crowd in.
Map the dependencies
Trace the components, suppliers and chokepoints that decide who actually captures value in a sector, not who appears to.
Price the risk
Assess policy, supply-chain and technology exposure across a value chain before the market puts a number on it.
Decide with evidence
Inform investment, sourcing and localisation choices from primary sources — filings, procurement data, government records.
Track sovereignty
Follow India’s path toward technology self-reliance, sector by sector, so you can see where the gaps are closing and where they are not.
Every load-bearing claim is traced to a primary source and labelled for confidence — the same evidence discipline used inside institutional and government research.
 ₹6,999
India’s Private Strategic Weapons Industrial Base
Market intelligence, technology sovereignty, and commercial capability across the missile, rocket, and precision-munitions ecosystem — 2026–2035.India’s strategic weapons industrial base has shifted structurally from a state monopoly to a distributed public–private ecosystem. A ₹2.45 lakh crore decadal addressable market (2026–2035) and DRDO’s Development-cum-Production Partner (DcPP) framework have pulled private primes to 24% of national defence production, with five industrial houses — L&T, Tata Advanced Systems, Kalyani, Adani and Solar — now holding end-to-end integration or critical prime sub-assembly capability. The transition is real but uneven: an 85–90% import dependency for terminal missile seekers and zero private-sector dynamic testing ranges remain the chokepoints that decide how much of the opportunity Indian industry captures. This 78-page report maps the capability matrix, the localisation-gap and value-chain structure, the industrial-corridor and geographic build-out, and three 2030–2035 scenarios — every exhibit carrying a [V] / [V1] / [Modelled] verification label.
 ₹4,900
India AI Data Centre Cooling 2026–2035
Market evidence, technology choices, and domestic supplier capability — from audited capacity inventories and verified transaction records.India's AI data-centre cooling opportunity is real but frequently overstated. This report replaces uncalibrated market forecasts with an audited H1 2026 capacity inventory — 1,789 MW operational, 509 MW under construction and 3,351 MW planned (Cushman & Wakefield) — and attributed external benchmarks rather than a single proprietary TAM. It shows that cooling architecture follows the whole system design, not a chip-power threshold (NVIDIA documents an air-cooled DGX B200), and that India's domestic capability is broader than assumed: Schneider's Bengaluru liquid-cooling factory, Vertiv's Pune manufacturing and rack-level co-engineering with Netweb. Global liquid-cooling revenue runs at roughly $3 billion (2025) toward about $7 billion by 2029 (Dell'Oro), and liquid-cooled builds carry a 7–10% construction premium (Turner & Townsend) — a whole-facility figure, not an India equipment quote. Across 59 pages, 22 tables and 43 sourced records, it separates observed stock from conditional pipeline, distinguishes India presence from indigenous IP, and frames the real execution risks — power, water, qualification and service support — for the policymakers, operators and investors deciding where domestic value can actually be captured.
 ₹6,999
India’s Military Aerospace Manufacturing Ecosystem
From aircraft assembly to industrial sovereignty — propulsion, subsystems, IP and exports, and the choice that decides 2035India’s military aerospace industry has reached an inflection point: a 1,500+ aircraft-and-helicopter procurement pipeline worth roughly ₹2,50,000 crore over 2025–2035, a private-sector prime layer that can now build (TASL’s C-295, HAL’s Tejas and rotorcraft, Mahindra, L&T), and policy tailwinds from the 75% domestic capital earmark and five positive-indigenisation lists. Yet the sovereignty question is unresolved below the airframe: India imports 85–90% of aircraft-engine value and depends on foreign supply for single-crystal turbine blades, FADEC, aerospace-grade semiconductors, AESA T/R modules and superalloys. This report maps the full ecosystem — the 16-subsystem architecture, the prime and Tier-1/2/3 supplier network, eleven ₹1,000 crore-plus opportunity surfaces, the critical-dependency chain, and a three-scenario 2035 outlook (Assembly Nation, Deep Localisation, Indigenous Stack) separated by whether India invests in the layers it does not yet own. It prescribes the capital, the certification capacity and the engine programme required to move from assembly to genuine industrial sovereignty.
 ₹6,999
The Cloud Question
India's Dependence on Foreign Hyperscalers and the Sovereign Cloud ChallengeIndia's public cloud spend reaches $17.5 billion in 2026 and heads toward $30 billion by 2029 (IDC) — yet 63% of the global market sits with three American hyperscalers (AWS 29%, Azure 20%, Google 13%), and India's enterprises are structurally bound to them. This report measures that dependence with a composite Enterprise Dependency Index of 0.63/1.00 and, across 14 parts, 150 chapters and 52 exhibits, separates the 2–4% of workloads (T1) that genuinely require sovereignty from the ~96% that do not. It maps the $45 billion+ of announced hyperscaler FDI (AWS $12.7B, Microsoft $17.5B, Google $15B), the ₹10,372-crore IndiaAI compute mission and its 38,000+ GPUs, the ~1.6 GW of live data-centre capacity against a 6–12 GW 2030 band, and the legal seam the US CLOUD Act opens against India's DPDP regime (Rules notified 13 Nov 2025). A switching-cost model, the Techadyant Cloud Opportunity Score and a four-scenario 2030/2035 forecast trace where a credible Indian sovereign-cloud alternative can realistically be built — and where it cannot. The central finding: sovereignty is not a wholesale exit from the hyperscalers but a targeted, tiered strategy, priced against genuine risk rather than rhetoric.
 ₹6,999
India's Industrial Technology Transfer Ecosystem
52 DRDO labs, 37 CSIR labs, 23 IITs, IISc and nine defence PSUs - why India's public R&D converts only ~1.1% of projects into products, and the five-pillar reform agenda that can move it from 5% to 12% of global deep-tech output.India has built one of the developing world's largest public research apparatuses - 52 DRDO laboratories, 37 CSIR laboratories, 23 IITs, IISc and nine Defence PSUs generating ~₹65,000 crore in revenue - yet converts it poorly: DRDO's project-to-product rate is an estimated ~1.1%, the DPSUs invest 1.4% of revenue in R&D against a 5-8% global benchmark, and the IITs convert ~7.7% of patents into spin-offs. R&D intensity stands at 0.65% of GDP, one-fifth the OECD average. With no Bayh-Dole-equivalent law, under-built technology licensing offices and a TRL 7-9 valley of death, the report maps where value leaks across DRDO, CSIR, IITs/IISc, DPSUs, TLOs, patents and spin-offs - and sets out a five-pillar reform agenda (legislative, institutional, capital, capacity, talent) with a $5 billion National Deep-Tech Fund, moving India from 5% (Incremental) toward 12% of global deep-tech output by 2035 (Accelerated base case).
 ₹11,900
India and the Emerging Lunar Economy
From lunar exploration to industrial participation. India has a narrow 2026–2032 window to convert precision-landing capability into a position in the lunar value chain — and the dominant prize is terrestrial industrial spillover, not lunar commerce.The lunar economy is emerging, but India is structurally under-positioned — roughly 3.3% of cumulative announced lunar-programme investment (about USD 6 billion of an indicative global USD 181 billion through 2024–2035). Yet India has a narrow, decisive 2026–2032 window to convert demonstrated precision-landing capability (Chandrayaan-3, achieved at about USD 75 million) and its post-2023 policy reforms into a strategically significant position in selected lunar value-chain segments. India has Tier-1 potential in five of the thirteen value-chain layers; the binding constraint is an estimated 90–95% import dependence in radiation-tolerant electronics, space-grade solar cells and travelling-wave tube amplifiers. Across fourteen chapters the report maps the global infrastructure race, India's position, the technology and supply-chain gaps, eight opportunity surfaces (a direct addressable market of roughly USD 250–450 million a year by 2030–2032), and six coordinated strategic moves. Its central finding: the dominant value capture is terrestrial industrial spillover — projected indirect returns of USD 18–95 billion to 2040 against direct lunar returns of USD 4–28 billion, roughly three-to-five times larger. 37 figures and eleven appendices; a companion thirteen-sheet intelligence workbook is available with the data tier.
 ₹6,999
India’s Aerospace Supply Chain: Missing Links
Missing Links Between Components and Complete Aircraft — Why India Has the Parts but Not the Platforms, and the Industrial Architecture That Closes the GapIndia’s aerospace industry is structurally bifurcated: it has built a globally competitive Tier-2/3 component base, yet still lacks the Tier-1 sub-system integration, unified type certification and serial final-assembly capability required to produce complete aircraft. This strategic-intelligence report identifies three "missing links" — integration, certification and final assembly — and shows why component capability does not automatically aggregate into aircraft capability. Against a $42B total addressable market in 2025, India’s serviceable obtainable market spans a 5× spread by 2035: $21.0B (bull), $11.7B (base) or $4.2B (bear), decided almost entirely by domestic execution inside the 2025–2027 policy window rather than by exogenous demand. The report scores India’s capability across ten dimensions (civil propulsion 1.5/10 vs a 9.5 global frontier), maps an 85%-concentrated engine supply chain, quantifies a 4.2-year average policy-implementation latency, and prescribes eight priority interventions — a National Aerospace Certification Authority, a $1.5B Tier-2/3 Supplier Development Fund, propulsion JVs and five domestic Tier-1 integrators — requiring ~$16.7B of coordinated capital. It also reads India’s emerging space-sector R&D-to-industrialisation model as an institutional analogue, without extending the report’s scope into space.
 ₹6,999
India AI Compute Corridor Economics, 2026–2035
Hyderabad vs NCR — Investment Viability, Power-Evacuation, Water Stress, Geography of Sovereign ComputeWhere should India site 500 MW to 1 GW of AI compute? This report ranks eight Indian corridors on the Techadyant AI Compute Viability Index (T-ACVI) — a nine-dimension framework weighted by infrastructure bindingness: power, water, transmission, land, connectivity, expansion, policy and AI ecosystem. Hyderabad (81.5), Gujarat (77.2), Andhra Pradesh (71.6) and Chennai (71.1) clear the investment-grade threshold, while NCR (63.7) — despite unmatched enterprise demand — suffers a 1.42× water-stress adjustment and a 640-basis-point IRR penalty versus Hyderabad on an identical 100 MW campus (22.8% vs 16.4% base-case IRR). India's AI compute demand reaches 1,960 MW by 2035 (28% CAGR), driving a USD 199 billion industrial TAM across compute, power, construction, cooling, connectivity and water. 101 pages, four analytical figures, three proprietary models and a live-formula data pack.
 ₹9,900
Industrial AI in Indian Manufacturing
Where, how and in what sequence Indian manufacturers should deploy industrial AI — priced against the loss base, not the vendor slide.The strategic question for Indian manufacturing in 2026 is no longer whether to deploy industrial AI, but where, in what sequence, and against what governance. This playbook sizes the Indian industrial-AI market at $4.8–6.2B by 2030 (32–38% CAGR), locates ~70% of addressable value in three operational levers — downtime, yield/scrap and energy — and quantifies the economics: a 2.4–3.2× TCO multiple over software cost, a 58% base-case three-year ROI for SMEs with a 14-month median payback, and a 35–45% pilot scale-up failure rate driven overwhelmingly by data (28%) and strategic (22%) failures rather than algorithms. 137 pages, 36 exhibits and a companion workbook with parameterised financial models.
 ₹6,999
Beyond Sea Drones: India's Autonomous Maritime Systems Ecosystem 2026-2035
Technologies, supply chains and industrial opportunities in India's USV/UUV ecosystem — three market scenarios to 2035, a 12-country Maritime Autonomy Readiness Index, 100 ranked opportunities and a 2026-2035 industrial roadmap.India's autonomous maritime systems (USV/UUV) market is projected to grow from a INR 2,200 crore 2026 baseline to INR 11,500 crore (Constrained), INR 35,000 crore (Baseline) or INR 55,000 crore (Accelerated) by 2035. This strategic intelligence report maps the ecosystem from primary sources, with every major claim numbered and verification-labelled [IN-XXX]. India ranks 9/12 on the proprietary Maritime Autonomy Readiness Index with a composite 4.5/10: fourteen active programmes and eight iDEX awards exist, but the subsystem base is only 15-70% indigenous (AI silicon ~15%, battery cells ~35%) and there is no certification authority. The report reframes the debate from platforms to subsystems, quantifies the MDA and ASW coverage gaps, benchmarks six countries (US, China, UK, Israel, South Korea, Singapore) with reconstructed 2024 budgets, and scores 100 opportunities on the 9-dimension Opportunity Priority Index (OPI) — 24 "Star" opportunities score 80+, led by an 11-metre ASW USV at 88. It closes with a three-phase 2026-2035 roadmap (INR 14,600 crore Phase I, 8-12x return on capital) and 45 recommendations across government (12), the Indian Navy (10), industry (10), startups (10) and investors (8). 136 pages, 29 chapters, 53 figures, 15 tables, 125 numbered sources and full appendices A-L, mirrored in a 17-sheet data workbook.
 ₹5,900
IAF Autonomous Air Power Roadmap 2026–2035
What industrial substrate must India build for autonomous air power — and how the IAF closes a 34/100 readiness gap against the USAF's 88 benchmark by 2035.India enters 2026–2035 with an assessed Air Autonomy Readiness Index of 34/100 — less than half the USAF benchmark of 88 — and the gap is concentrated in the AI software stack (-56 vs USAF) rather than aircraft. This strategic-intelligence assessment argues that the decade's defining task is the industrial substrate beneath autonomous air power: four critical-risk dependencies — semiconductors, AI compute, jet engines and carbon fibre — each scored 20/25 on the Strategic Dependency Matrix, none fully mitigable before 2030. The cost-exchange ratio has flipped nearly three orders of magnitude (1.5:1 in 1990 to a projected ~750:1 for autonomous swarms vs exquisite SAMs by 2035), making exquisite-heavy air defence structurally unaffordable against autonomous mass. If India holds the intervention path, the report models AARI 58–62 by 2035 (42–46 under no intervention); a 31-squadron IAF in MUM-T configuration delivers the combat mass of a 60+ squadron legacy force. The IOSM ranks 75 opportunity surfaces; recommendation R2 proposes a $5B/10-year Autonomous Aerospace Fund. Twelve chapters, six appendices, six proprietary frameworks.
 Free
FreeKalpasar Economic Impact Assessment
A platform-infrastructure lens on India’s unsanctioned multi-billion-dollar bay projectThis strategic assessment examines the Kalpasar bay project through a platform-infrastructure lens, evaluating why a project conceived as a national game-changer has remained in discussion for decades without construction, financial close or binding environmental clearance. The report maps the engineering dependency surfaces — dam engineering, marine works, power evacuation, coastal-zone clearance and water-rights allocation — and explains why fragmented agency accountability has prevented a credible implementation sequence. It reviews the financing pathways that would be required for a project of this scale, from central budget and public-private partnership variants to blended multilateral and commercial debt structures, and explains why lenders require conditions that have not yet been met. The analysis also traces the milestone dependencies: detailed project report, independent peer review, inter-state agreement, land acquisition, long-lead marine procurement and financing close. Across six chapters the report provides a structured pre-project roadmap, dependency mapping, implementation risk analysis and a clear verdict: Kalpasar is defensible as a strategic idea, but it is not yet ready to build.
 ₹4,900
The Hydrogen Mirage or Machine?
India’s green-hydrogen industrial reality — electrolysers, catalysts, and whether the molecule can be made without importing the machine.Green hydrogen has moved in thirty months from the margins of Indian energy policy to its centre: the National Green Hydrogen Mission committed ₹19,744 crore in January 2023, and the SIGHT scheme (₹17,490 crore — about ₹4,440 crore for electrolyser manufacturing and ~₹13,050 crore for production) targets 5 MMT of green hydrogen and 60 GW of electrolysers by 2030. This strategic-intelligence report argues India has built its policy around the molecule but not the machine. Green hydrogen is a molecule; the electrolyser is the machine that makes it — and the machine depends on catalysts (iridium and platinum, of which India produces zero), PFSA membranes (IP held by three Western firms), and critical materials India barely processes. India’s effective electrolyser output is under 1 GW against China’s ~45 GW, and China holds ~60% of global manufacturing capacity. Across eighteen chapters the report maps the six supply-side vulnerabilities, the LCOH economics, the SIGHT programme, demand across refining/steel/fertiliser, the strategic control points, and three 2035 scenarios — Mirage, Muddle or Machine — with the base case (Muddle) missing the 5 MMT target by ~30%. Fifty-plus data tables, ~24 figures, and a companion data workbook.
 ₹6,999
Beyond Solar Panels
India built the world’s largest solar-deployment machine — but value and vulnerability live upstream of the panel. Mapping the hidden industrial stack: polysilicon, wafers, cells, glass, gases, chemicals and manufacturing equipment.India has built one of the world’s largest solar-deployment machines — 162.15 GW of installed solar capacity by 30 June 2026 (MNRE), against a 2030 objective of 280 GW of solar within 500 GW of non-fossil capacity. But deployment has outrun manufacturing depth. This report reframes the question away from module assembly toward the industrial system beneath it: capability inverts value across the stack — India is strongest downstream in modules (~172 GW of ALMM-listed capacity) and materially weaker upstream in cells, wafers, polysilicon, specialty chemicals, industrial gases, solar glass and production equipment, where China holds roughly 85% of solar supply-chain capacity and about 95% of wafer capacity (IEA 2026). Across thirteen chapters it maps the manufacturing stack, the hidden material and equipment foundations, localisation economics, the industrial opportunity surfaces, state-level clusters, technology transitions and a roadmap to solar-manufacturing sovereignty — with an investment-intelligence playbook. Fifty-three tables, twenty-two figures and seven appendices; a companion data workbook is available with the data tier.
 ₹5,900
The Indian Navy’s Autonomous Maritime Transformation 2026–2035
Platforms are downstream of ecosystems. What industrial substrate must India build to field an autonomous fleet — and who captures the ₹1.2 lakh crore market beneath USVs, UUVs, XLUUVs and naval UAVs?India’s naval autonomous transformation over 2026–2035 is technically feasible and strategically necessary — but its pace will be set less by platform decisions than by the maturation of the underlying industrial substrate. This strategic-intelligence assessment argues that platforms are downstream of ecosystems, and identifies three binding constraints: semiconductor access (marine-grade FPGAs, RF integrated circuits, AI-edge NPUs), test-and-certification throughput (DGQA and CemILAC capacity), and a projected 12,000–18,000-engineer workforce deficit by 2030. If those are addressed, the Navy can field a credible force posture under the recommended ‘Autonomous Power’ scenario — 80+ USVs, 25+ UUVs including XLUUVs, and 180+ naval UAVs by 2035 — and Indian industry can capture ₹15,000+ crore in annual revenue by 2035 (₹5,000+ crore export), building to a cumulative 2026–2035 market of approximately ₹1.2 lakh crore. The report ranks 58 industrial opportunity surfaces (nine Strategic Anchors), scores India against six comparator navies, maps the DRDO/DPSU/private/startup ecosystem, and models four scenarios to 2035. Twelve chapters, ~35 figures, eight proprietary frameworks and full appendices.
 Free
FreeQ-Day India
India’s post-quantum cryptography readiness and migration architectureQ-Day is not a date on a calendar; it is a migration problem. This free strategic-risk report maps how India can inventory cryptography, protect long-life data, build crypto-agility and sequence post-quantum migration across public infrastructure, BFSI, telecom and critical systems — before a cryptographically relevant quantum computer arrives. It covers the harvest-now-decrypt-later threat, the NIST post-quantum standards, global migration mandates, vendor concentration risk, and a five-action agenda for Indian organisations in 2026.
 ₹6,999
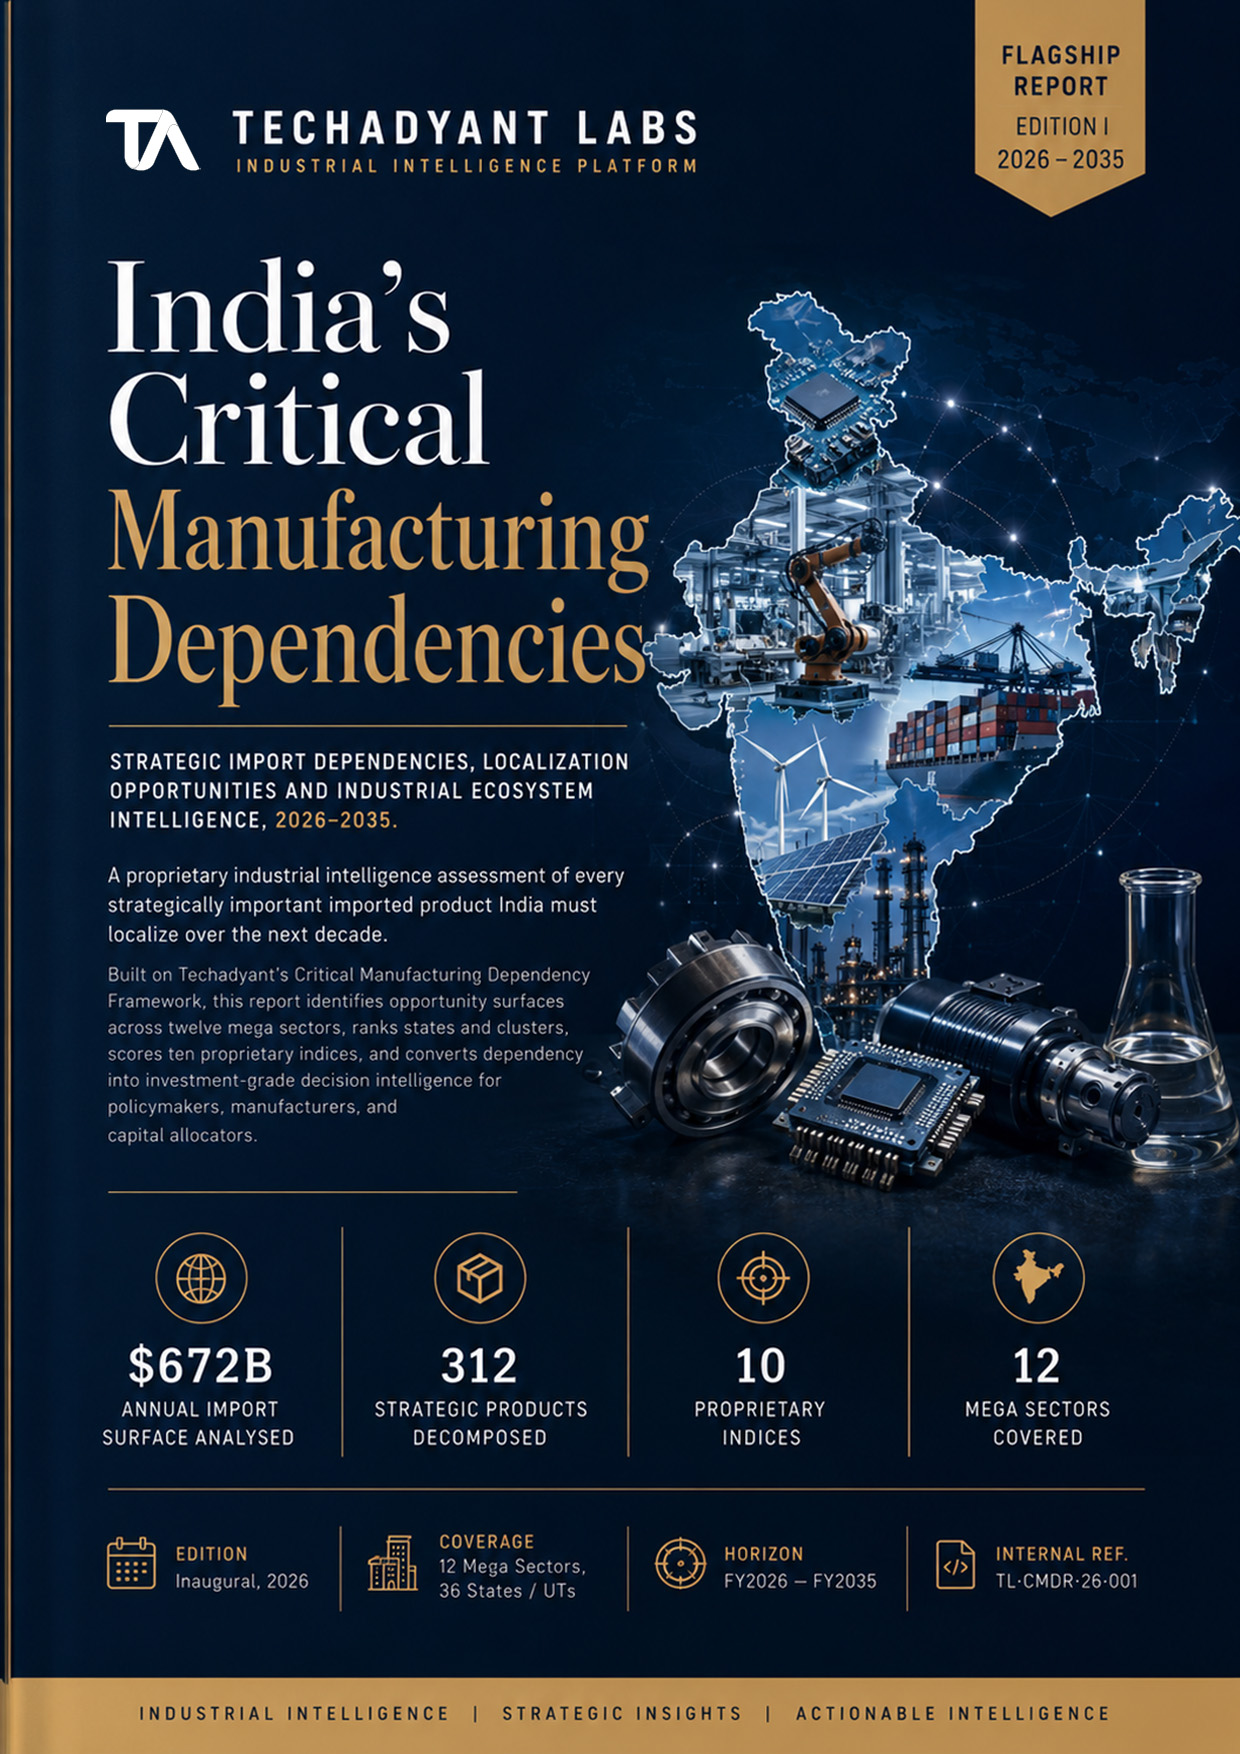
India’s Critical Manufacturing Dependencies
What should India manufacture domestically over the next decade — why, where, how, and who should build it? 312 strategic import surfaces scored across twelve mega-sectors on the Critical Manufacturing Dependency Index, with twelve executable opportunity zones.India does not have an import problem; it has an industrial-capability problem disguised as one. This inaugural edition treats the customs ledger as a diagnostic signal, identifying, scoring and decomposing 312 strategic opportunity surfaces across twelve mega-sectors on the proprietary Critical Manufacturing Dependency Index and nine companion indices. India’s manufacturing value added is about $470 billion — 2.9% of the global total — while roughly $506 billion of its $672 billion merchandise imports are strategic. Two imperatives govern the response: localise the single-source chokepoints before the volume (a $400 million EUV-photoresist import is more urgent than a $4 billion commodity), and descend the industrial stack from final assembly toward components, materials, machinery and test-and-certification. The report concentrates capital on twelve executable opportunity zones — from semiconductors in Dholera to Li-ion cells in the Chennai corridor — within a roughly $480 billion, largely private, phased localisation envelope over 2026–2035, set against $5.6 trillion of strategic imports if nothing changes. Thirteen chapters, 46 tables, 30 figures, the underlying CMDD database and full appendices.
 ₹4,900
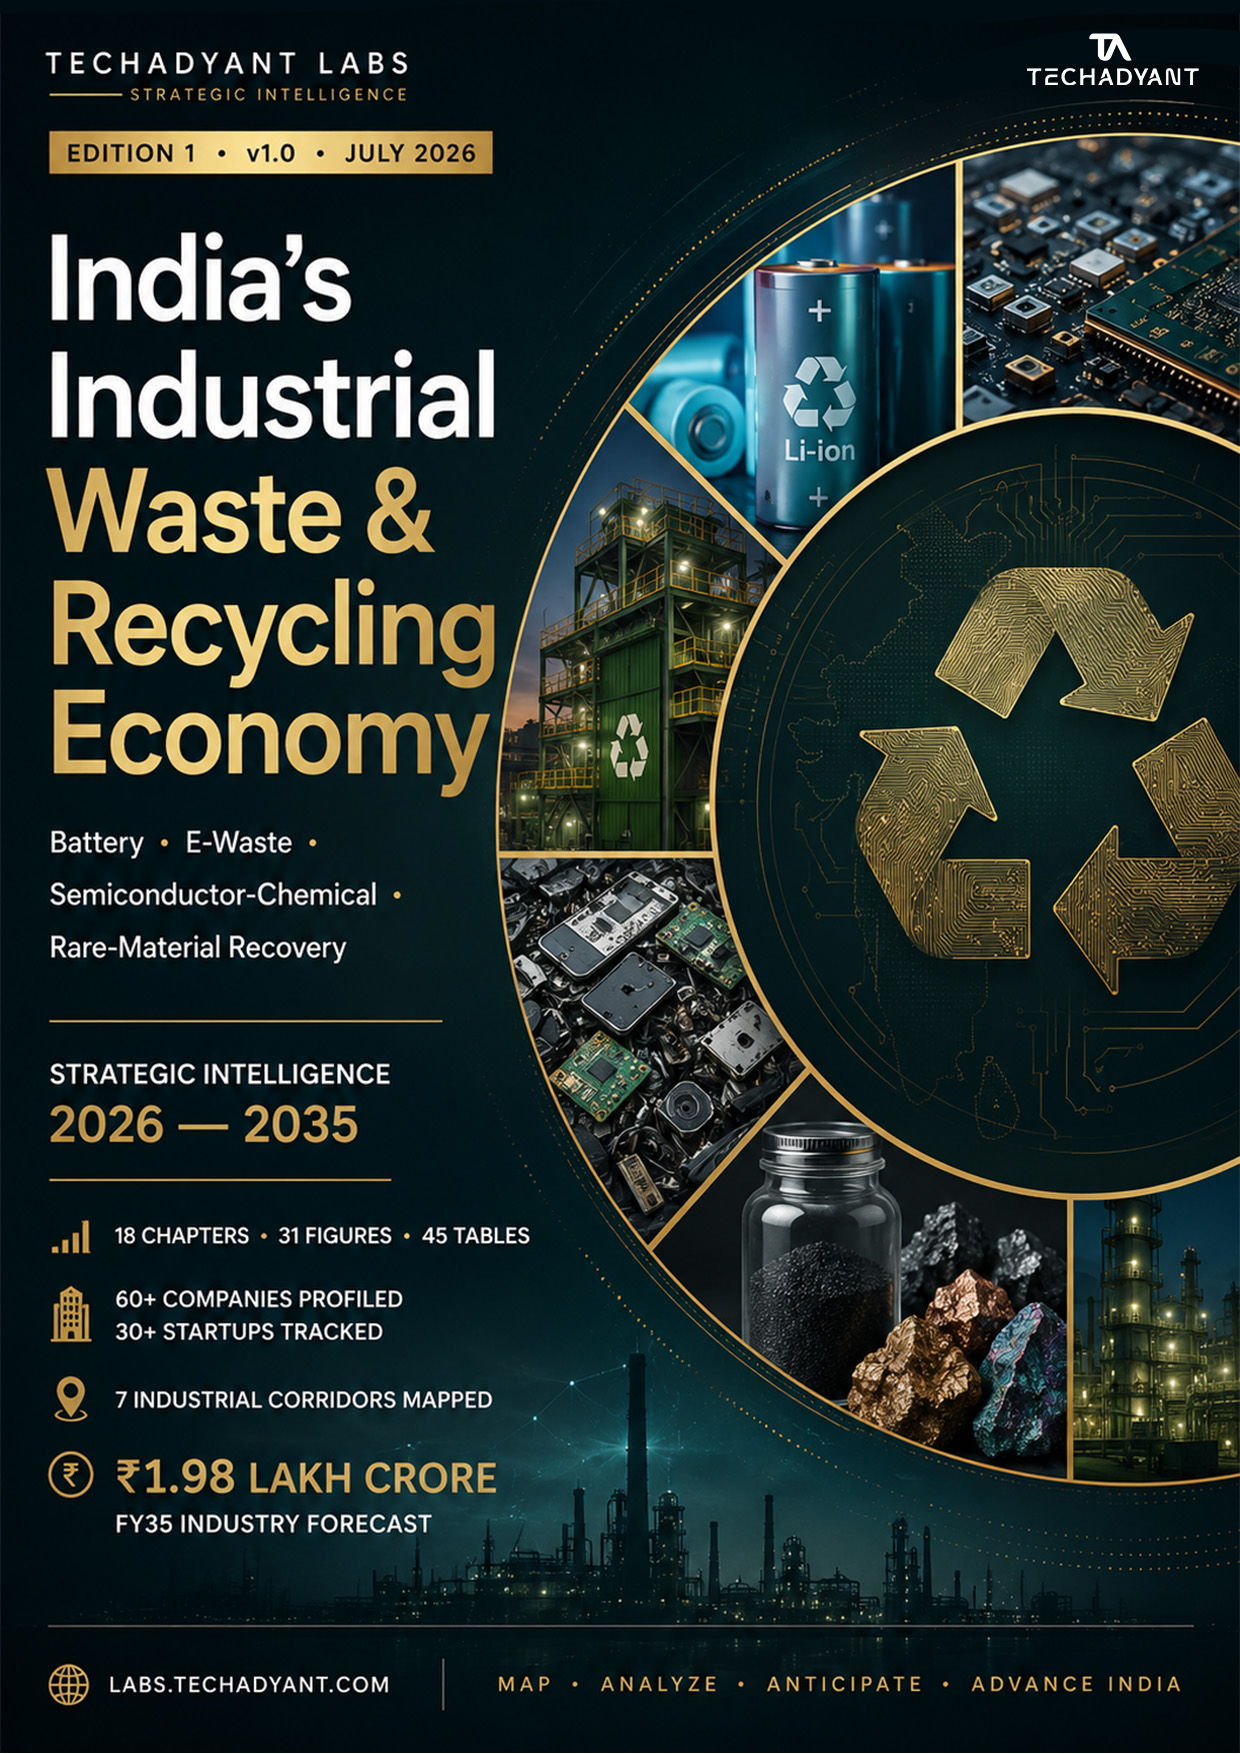
India's Industrial Waste & Recycling Economy
Battery metals, e-waste, chemical recovery and the secondary-industrial opportunity across Indian recycling corridorsIndia is sitting on a secondary-industrial frontier: industrial waste and recycling is rapidly shifting from downstream disposal to upstream industrial infrastructure, and the agencies, investors and manufacturers that map it first will capture the corridor-level value. This report provides a strategic intelligence read across India's emergent recycling economy — battery metals, e-waste streams, black mass, chemical recovery and the investment logic of secondary industrial corridors. It maps import dependencies, policy levers, technology readiness and capital formation in the recycling stack, and names the specific recycling corridors where value actually accrues through 2030.
 ₹5,900
India's Semiconductor Supplier Ecosystem: The Dholera Play
Mapping the supplier stack, anchor investments and build-ready parts for Dholera as a fab-led industrial node.Dholera is being positioned as India's anchor fab-led industrial node, but supplier ecosystem readiness is only partially mapped. This report moves from announcement-stage coverage to component-level readiness assessment across wafer fabrication equipment, bulk gases and chemicals, photoresists and substrates, packaging-and-testing infrastructure, materials handling, power and water utilities, and the policy levers that determine whether a project becomes a production node rather than a land-and-incentive headline. It maps India's existing semiconductor manufacturing base—Tata Electronics fab at Dholera, ISM-approved projects, OSAT/ATMP facilities, compound-semiconductor units, packaging clusters and downstream electronics demand—against the actual supplier presence in Gujarat and the broader domestic base. The core finding is that localisation is uneven: packaging-and-testing and mature-node backend segments show more buildable supplier depth than front-end wafer fab materials, equipment subcomponents and high-purity consumables. Industrial policy, continuous power, ultrapure water, logistics connectivity and skills availability are now the binding constraints, not capital commitment alone. The report scores supplier readiness by segment, identifies the highest-value localisation opportunities, names the import-dependent chokepoints, and lays out a phased industrial-policy and infrastructure agenda for converting Dholera from a fab site into a self-reinforcing semiconductor supplier ecosystem. 96 pages, 34 figures, 18 tables, 5 appendices with supplier, policy, infrastructure and investment reference tables.
 ₹6,999
The Hidden Supply Chain of Quantum Computing
Cryogenics, Control Electronics, Photonics and India's Missing Industrial BaseThe world watches the qubit; the value, the margin and the dependency sit everywhere else. This report maps the hidden supply chain beneath quantum computing — cryogenics, control electronics, photonics, packaging and high-purity materials — where a 100-qubit machine's cost actually accrues (the qubit chip is under 8%; the hidden stack is about 63% of a ~$5.15M system). It scores India's capability layer by layer against the global frontier, finds near-total import dependency and single-source chokepoints across every critical component, sizes the patent, funding and talent gaps, and sets out a ten-year, ~$5.25 billion industrial roadmap to build a defensible position. 150+ pages, 100 figures, 20 tables, seven appendices with company, startup, policy and funding databases, and a 17-sheet data workbook.
 Free
FreeSecuring India's Industrial Future
A Strategic Roadmap for Critical Minerals and Materials Dependency, 2026–2035India has secured access to critical minerals but not the capability to process them. This report maps India's dependency on critical minerals and advanced materials across the full value chain — upstream exploration, the midstream processing and refining bottleneck where China holds an estimated 60–90% of global capacity, and downstream demand from EVs, defence and net-zero energy — and quantifies it through a multi-dimensional Critical Mineral Vulnerability Matrix. It reads the National Critical Mineral Mission (₹16,300 crore) and the ₹1,500 crore Critical Mineral Recycling Incentive Scheme against the scale of the gap, and sets out a three-phase strategic roadmap to 2035 across policy, midstream capacity, circular economy and downstream integration. 169 pages, 16 figures, 29 tables, a 12-sheet workbook and an executive edition; verified to primary government sources, with all modelled estimates labelled.
 ₹6,999
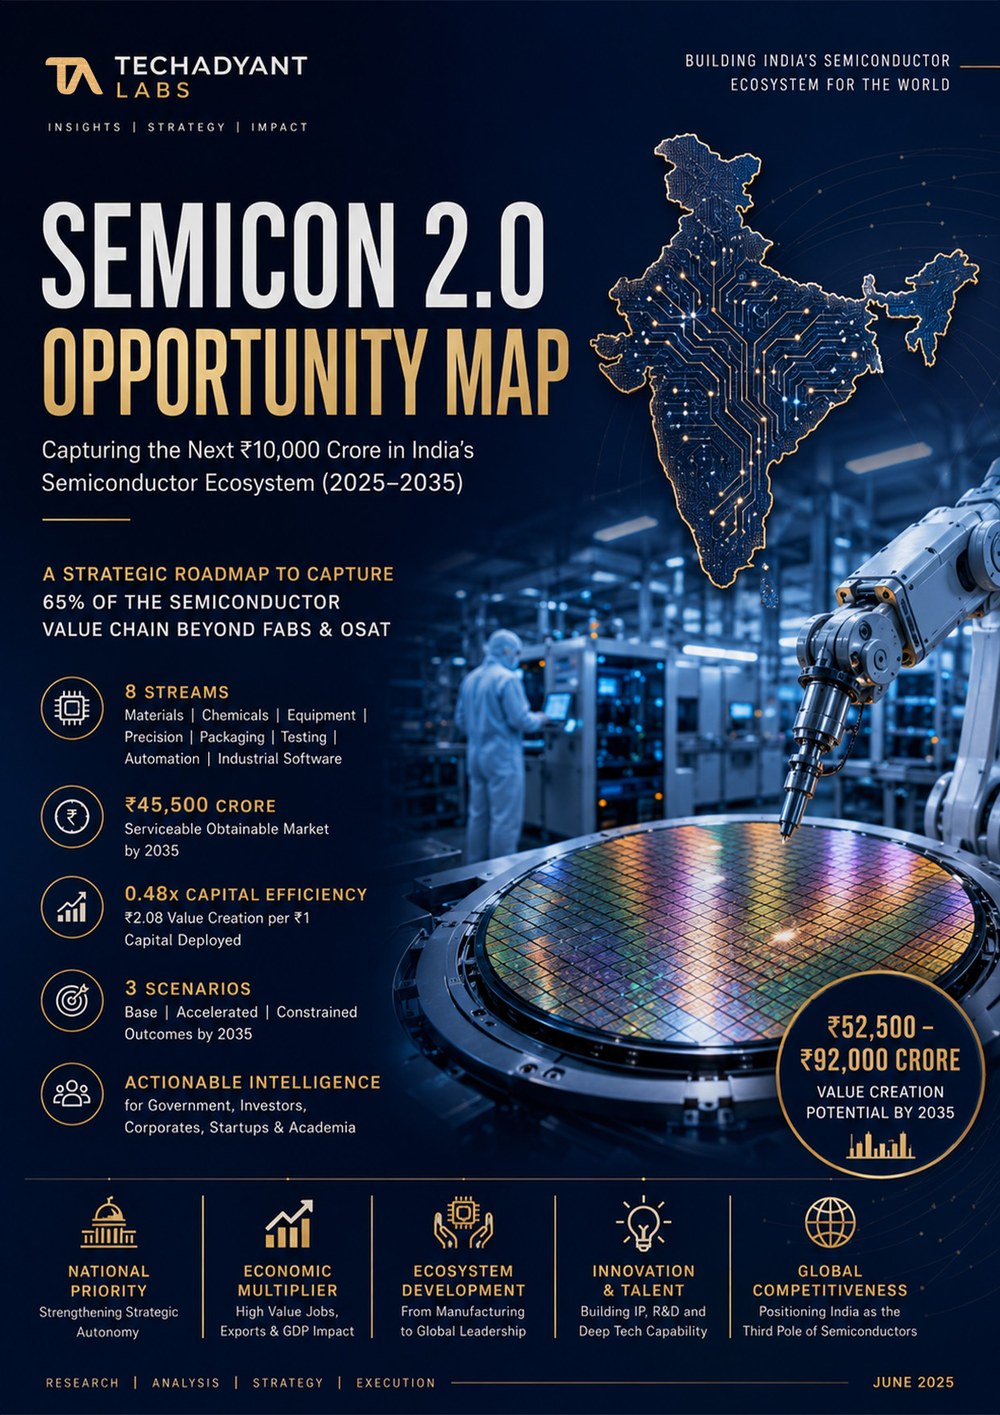
The Semicon 2.0 Opportunity Map
India funds the fab — but 65% of semiconductor value, and 78% of the margin, sits in the eight upstream streams it still imports. A stream-by-stream map of the Rs 95,500 crore obtainable (SOM) opportunity beyond fabrication — materials, chemicals, equipment, precision manufacturing, packaging, testing, automation and industrial software — ranked and sorted into three capital-allocation tiers.In July 2026 the Union Cabinet approved the second phase of the India Semiconductor Mission — a roughly Rs 1.27 lakh crore, six-pillar programme that, for the first time, extends state support beyond fabrication into materials, equipment, chemicals and the wider component ecosystem. This report maps that shift. The fab is only about 35% of the semiconductor value chain; the eight upstream streams beyond it — materials, chemicals, equipment, precision manufacturing, packaging, testing, automation and industrial software — hold roughly 65% of the value and 78% of the gross-margin pool, and India imports almost all of it (an estimated 99% of lithography equipment, 95% of photoresists, 92% of specialty gases). Techadyant Labs sizes the ten-year geographic addressable market (TAM) at about Rs 427,500 crore, India's serviceable available market (SAM) at Rs 217,600 crore, and the realistically obtainable market (SOM) at about Rs 95,500 crore by 2035, ranks all eight streams, and sorts them into three capital-allocation tiers — what to speed up now, what to invest in with government co-investment, and what needs sovereign patience. Fifteen chapters, twenty-six figures, a ten-sheet data workbook and full appendices; all market-sizing is Techadyant Labs' own modelling and load-bearing external facts are traced to source.
 ₹4,999
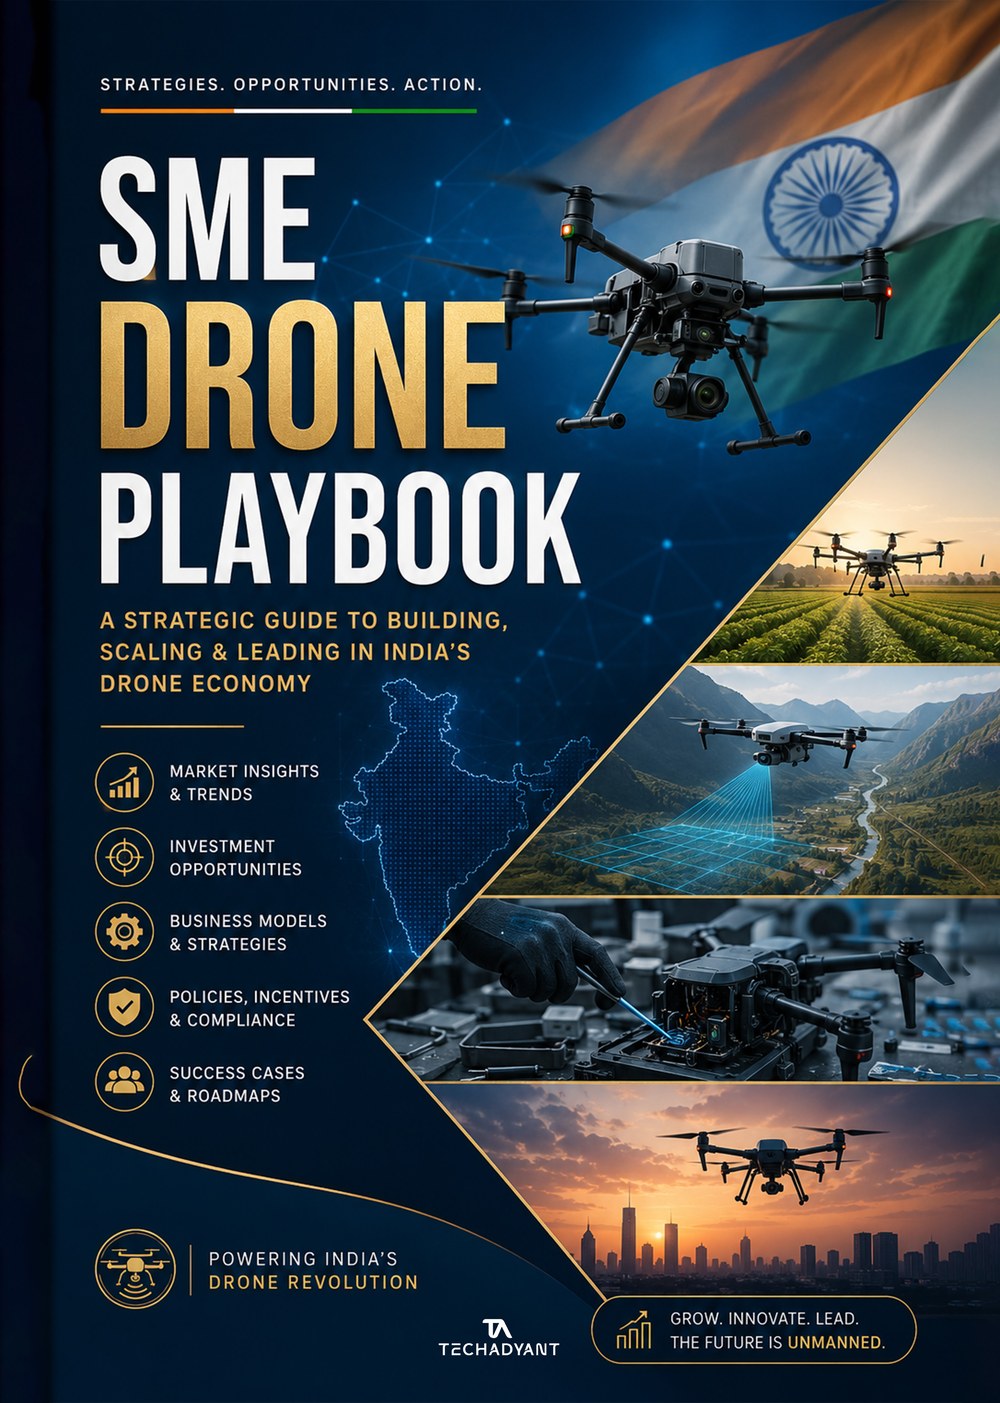
The SME Playbook for India's Drone Economy
A commercially actionable guide for investors with ₹50 lakh–₹5 crore. Eight opportunity segments scored on investment, gross margin, payback and SME suitability — from MRO and training to software, inspection and component manufacturing — plus a decision matrix, per-segment entry roadmaps and 24-month action agenda.India's drone economy has matured into a regulated, commercially viable industry — 38,500+ registered drones, 39,890 certified pilots, 244 DGCA-approved RPTOs. This playbook is written for the ₹50 lakh–₹5 crore investor: it scores eight business segments on capital, gross margin, payback and SME suitability, identifies where value actually accrues (components not assembly; the aftermarket and services layer over the airframe), and gives each segment a step-by-step entry roadmap, an investment decision matrix and a 24-month action agenda.
 ₹4,999
India's Industrial Water Opportunity Map
India's Industrial Water and Wastewater Infrastructure Market, 2024–2030India's industrial water and wastewater infrastructure market is projected to grow from USD 2.87 billion in 2024 to USD 4.65 billion by 2030 (Frost & Sullivan) — an 8.3% CAGR driven not by choice but by regulatory enforcement and hydrological constraint. This opportunity map sizes the market across five solution tiers, eight industry verticals and six states, and locates where the returns actually sit: semiconductor-grade ultrapure water, digital and AI water platforms, operations-and-maintenance annuities, and zero-liquid-discharge with resource recovery. It carries decision-grade frameworks — a Policy Risk Matrix, Value Chain Economics, a Five-Forces read and an Investment Heat Map — three named scenarios to 2030, and stakeholder playbooks for investors, technology providers, policymakers and industrial buyers. Twelve chapters, 119 tables, 46 charts, verified company profiles and a full financing analysis, with every market figure attributed to its source.
 ₹4,999
India’s Cargo Drone Demand Intelligence 2026–2035
Which industries will fly India’s cargo drones, when, and who captures the ecosystem? Ten demand ecosystems, three scenarios to 2035, a proprietary Adoption Readiness Index™, and the 25 hidden opportunity surfaces from healthcare logistics to MRO.India’s civil cargo drone fleet is projected to grow from roughly 850 units in 2026 to between 14,800 and 142,000 units by 2035. This market-intelligence report reframes the question away from “how many drones” toward which industries generate the demand, why, when, and what industrial ecosystems that demand creates. The Base Case places the 2035 fleet at 50,200 units and INR 18,400 crore (USD 2.2 billion) of annual revenue — a 63% CAGR — with an Accelerated case reaching 142,000 units and INR 46,500 crore. Demand concentrates in ten ecosystems, of which four — healthcare logistics, industrial-campus logistics, mining, and agriculture — score as Tier-1 lead adopters on the proprietary Cargo Drone Adoption Readiness Index™. The most valuable plays lie not in drone manufacturing but in the supporting ecosystem: twenty-five hidden opportunity surfaces are identified, the top five (UTM SaaS, MRO hubs, drone-port infrastructure, battery swapping, and motor/composite component manufacturing) representing an INR 5,250 crore addressable market by 2030. Seventeen chapters, twenty tables, twenty figures, three scenarios and full appendices.
 ₹6,999
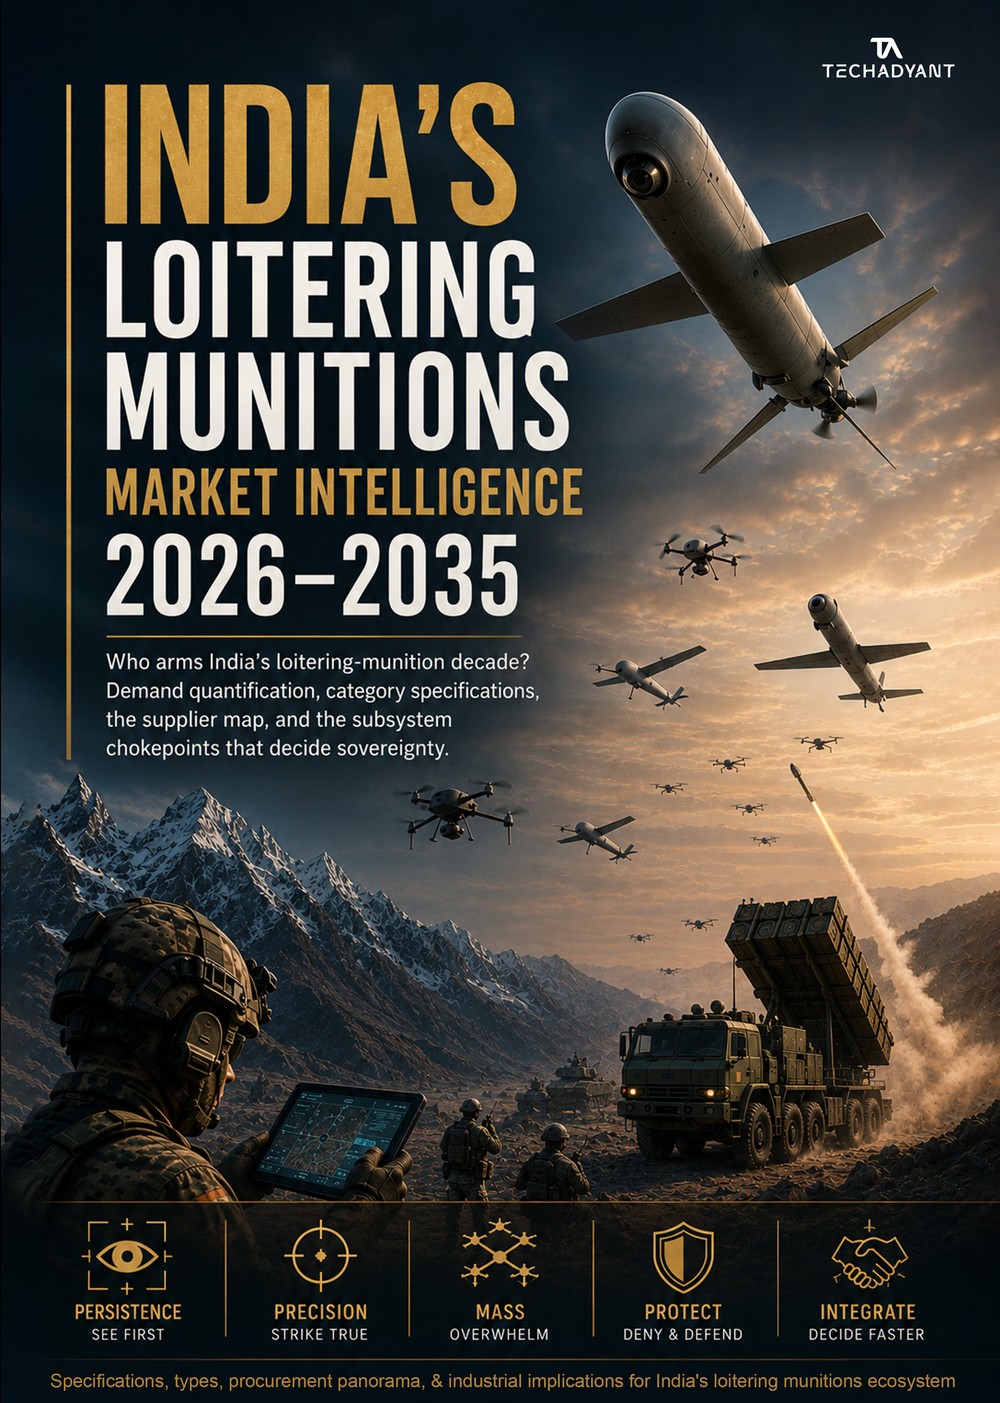
India’s Loitering Munitions Market Intelligence 2026–2035
Who arms India’s loitering-munition decade? Demand quantification, category specifications, the supplier map, and the subsystem chokepoints that decide sovereignty.India has entered a ten-year window in which loitering munitions move to the centre of its land-warfare doctrine. Operation Sindoor in 2025 turned the shift into a procurement fact — ₹9,100 crore of emergency powers, roughly 80% of the field-formation tranche directed to loitering and kamikaze systems, and a December-2025 DAC clearance of about ₹79,000 crore that named a Loiter Munition System for Artillery Regiments. This market-intelligence report argues India has a sovereignty problem, not a capability one: it can build world-class systems — Nagastra, ALS-50, SkyStriker, ULPGM-V3 — but depends on China for roughly 90% of its flight controllers and rare-earth magnets and about 84% of its lithium-ion cells. It models the ten-year demand bottom-up, maps the domestic and foreign supplier base, scores subsystem sovereignty across the value stack, and sets out a datable path to 2035 — with the Budget FY26-27 earmark of ₹1.39 lakh crore (75% of capital acquisition) for domestic procurement as the protected runway. Six parts, seventeen chapters, twenty-five figures and full appendices.
 ₹4,999
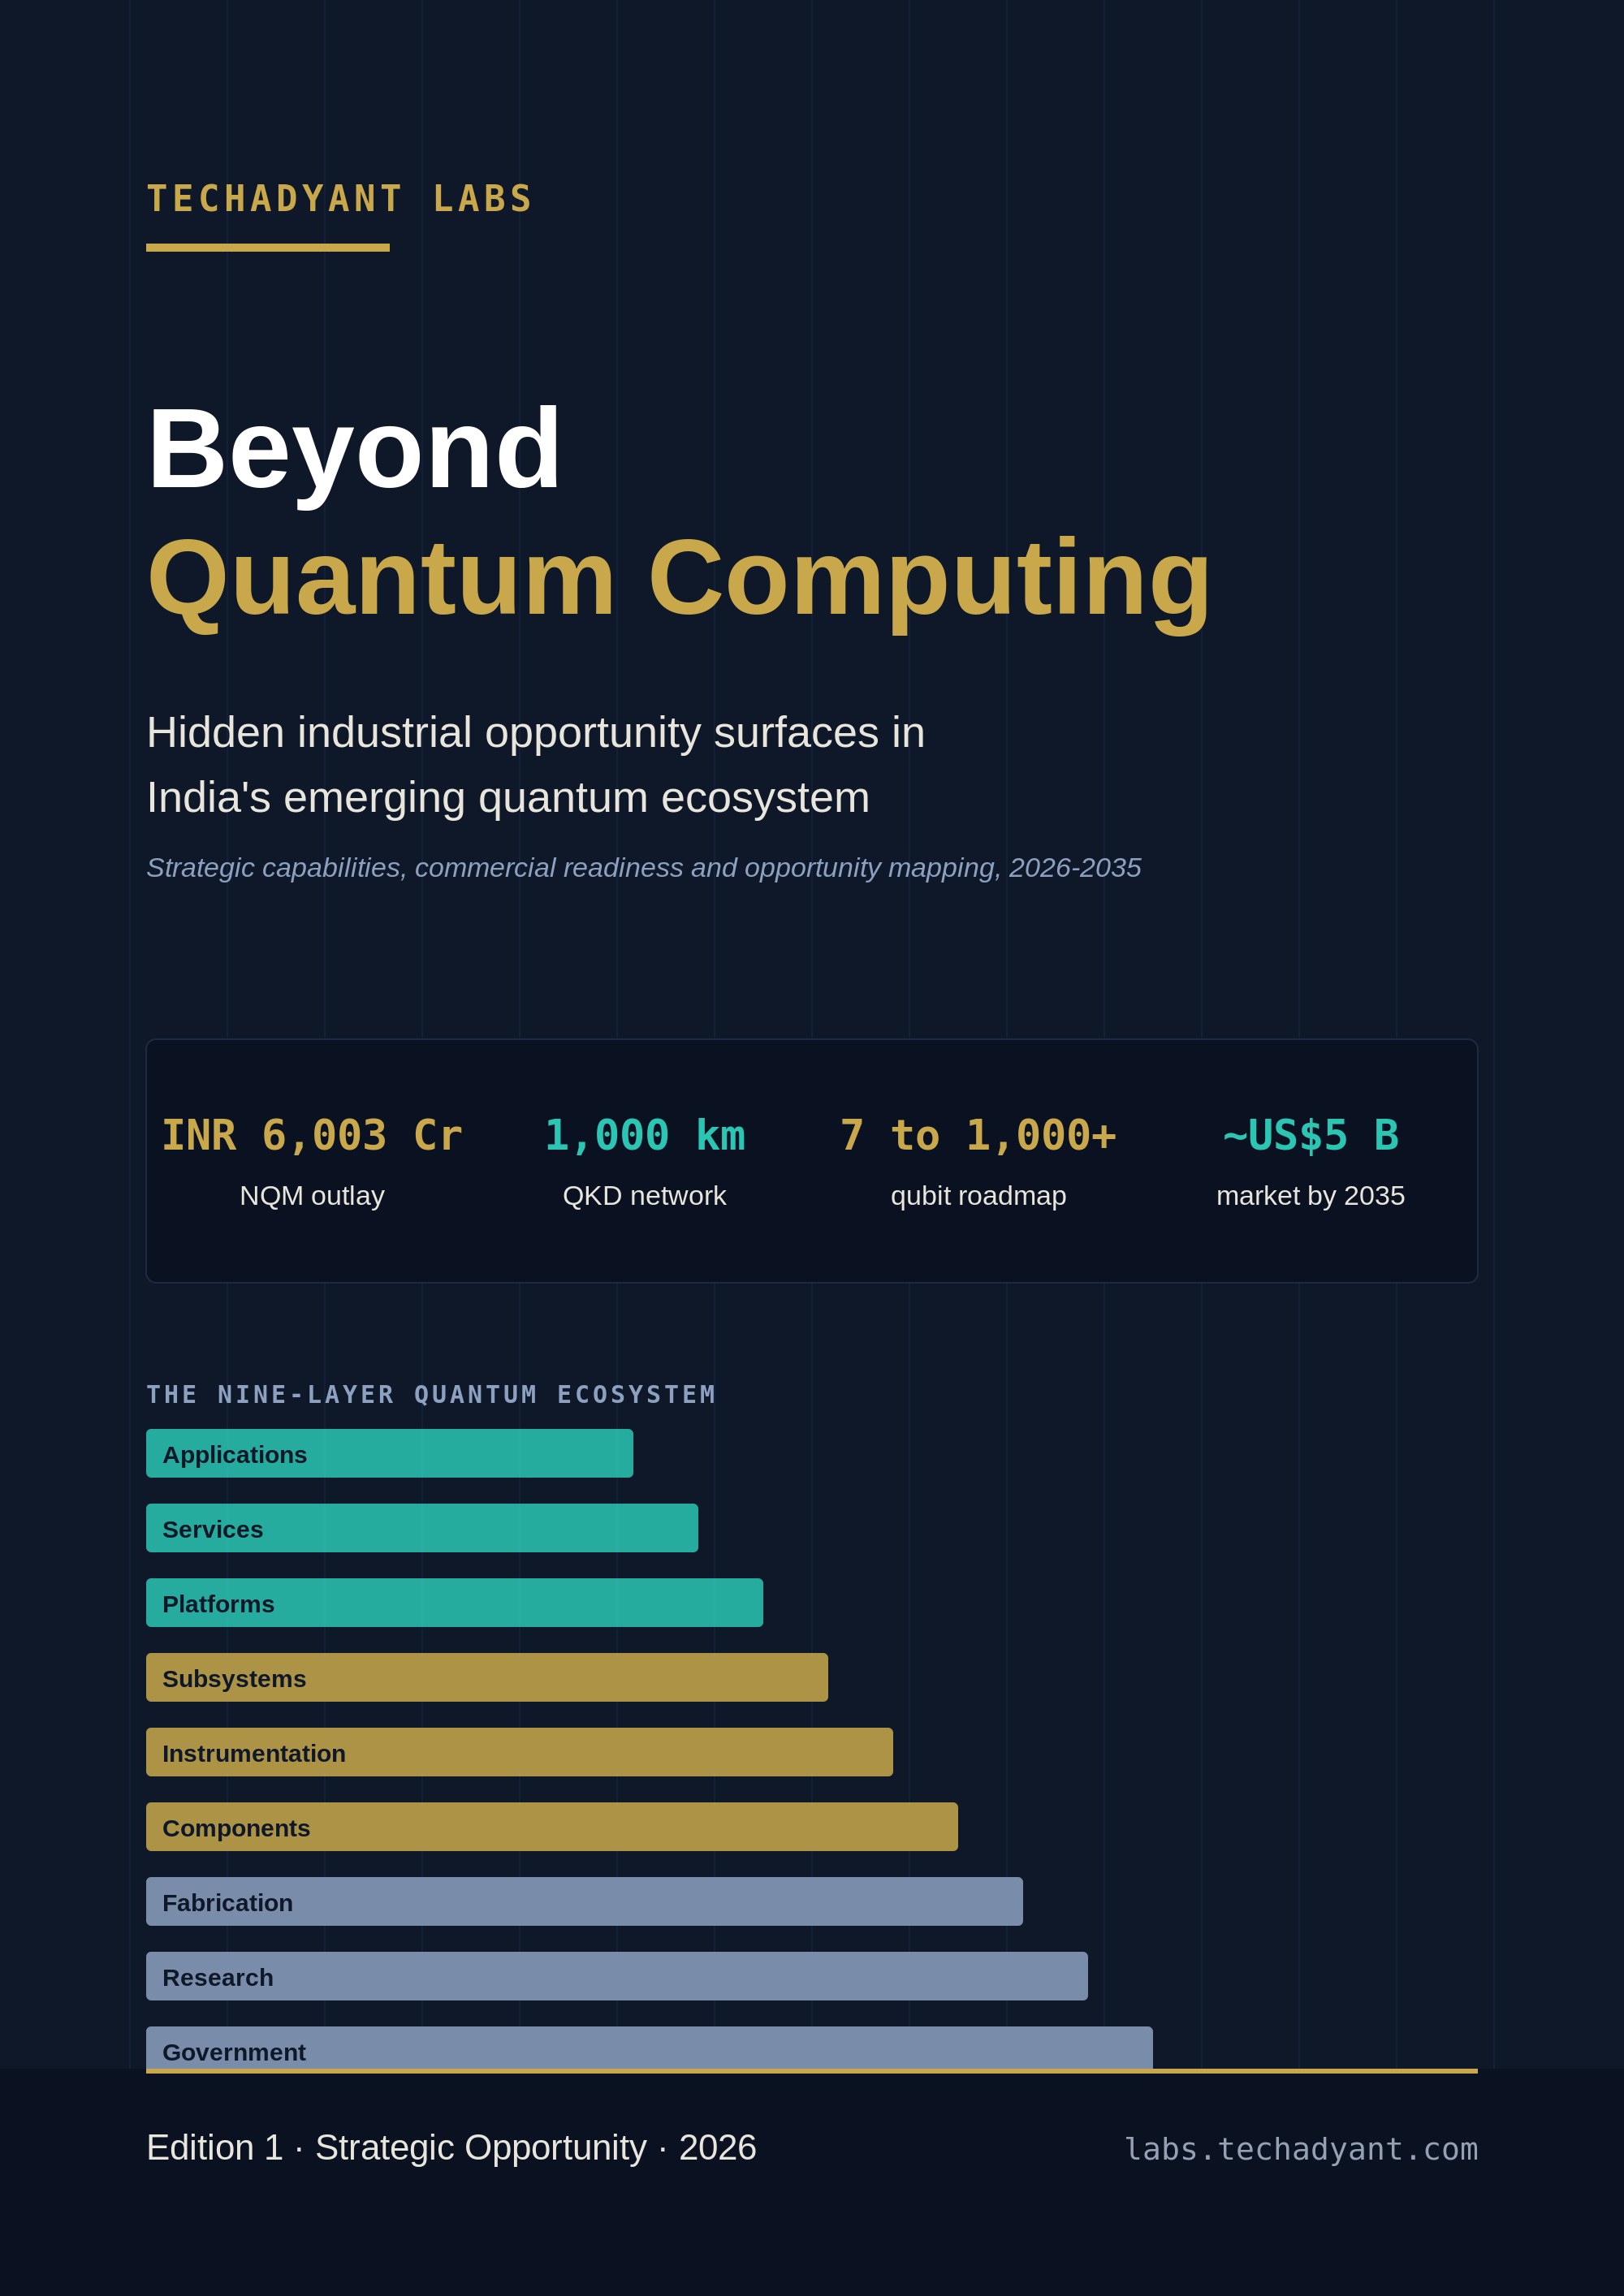
Beyond Quantum Computing
Hidden Industrial Opportunity Surfaces in India's Emerging Quantum EcosystemIndia's quantum conversation is dominated by the race to build a quantum computer. The larger story is the industrial ecosystem forming around it — computing, communication, sensing, cryogenics, photonics and post-quantum security — and where India can actually capture value. Backed by the ₹6,003 crore National Quantum Mission, India leads at the quantum-security and software layers (QKD, QRNG, full-stack systems) yet imports an estimated ~90% of the critical hardware beneath them. This report maps the emerging ecosystem layer by layer, scores the opportunity surfaces, and identifies where India's startups, MSMEs and investors can build beyond the quantum computer itself.
 ₹7,499
India’s Unmanned Warfare Transformation
Reconstructing the Indian Army Roadmap for Unmanned Aerial Systems and Loitering Munitions, 2026–2035 — and Pricing the Industrial Opportunity Beneath ItIndia’s Army is not buying drones — it is rebuilding the architecture of land warfare around unmanned, autonomous and attritable systems, a procurement signal of INR 1.0–1.9 lakh crore through 2035 against a INR 2–3 lakh crore economic footprint. This report reconstructs that roadmap and prices the opportunity beneath it, and its central finding is uncomfortable for an industry organised around airframes: the money, the margin and the sovereignty sit not in the platform the Army buys but in the subsystems it buys again with every unit — a roughly INR 40,000 crore import-substitution prize in sensors, seekers, propulsion, RF and silicon. Eighteen chapters, thirty-one figures and fifty-three tables; three proprietary frameworks (the Autonomous Warfare Stack, the Attritable Warfare Index and the Drone Industrial Sovereignty Matrix); a full market model (TAM/SAM/SOM, a procurement-wave model and an indigenous-content model); the competitive landscape and capability-gap map; strategic implications with playbooks for startups, MSMEs, large firms and venture investors; three quantified scenarios and a risk heat map. Every purchase includes a twenty-five-slide investor briefing deck (editable).
 ₹6,999
Who Controls India’s Drones?
Flight Controllers, AI Autonomy, and India’s Strategic Dependency in the Drone Control StackIndia assembles drones it cannot fully control. Official data placed before the Lok Sabha in April 2025 record 39% of flight controllers in DGCA-certified small drones as Chinese-sourced; across the whole fleet the effective figure is 70–80%, and the processors and MEMS inertial sensors at the base of the stack are roughly 100% imported. This report maps that control-stack dependency layer by layer and scores it on four proprietary frameworks — the Drone Autonomy Value Chain, the Strategic Vulnerability Index, the Import Vulnerability Matrix and a five-level Autonomy Maturity Model. It sizes the domestic substitution opportunity the new INR 2,000 crore PLI scheme unlocks (USD 500 million+ a year in addressable value), names the winners and losers across four policy levers (PLI, the Army 515 model, BVLOS and procurement preference), and sets out five costed recommendations and a selective-sovereignty path to 2035. Seventeen chapters, thirty-five figures, the Strategic Vulnerability Index and the Drone Autonomy Opportunity Map.
 Free
FreeWho Captures Computing When the Application Disappears?
The End of the Application Era — How Agentic AI Forces the First Operating-System Redesign Since the Cloud, and Where India Can Capture the Next LayerEvery fifteen-to-twenty years the operating system is redesigned, and agentic AI is the trigger for the next one. As work shifts from applications a human opens to goals an agent pursues, the three foundations of the modern OS — CPU-centric scheduling, human-login security and application-siloed state — break at once. This report argues that value migrates down from the application layer into four control primitives — accelerated inference, identity, memory and scheduling (AIMS) — and scores who is positioned to own them on a proprietary Agent-Native Capture Index (ANCI): in 2026 there is no Primitive Owner, and the leaders win on breadth, not depth. It maps the Post-Application Stack layer by layer, traces the hardware chokepoints (advanced packaging, HBM, export policy), and sets out where India — strong in public digital infrastructure and sovereign compute, dependent on the AIMS primitives — can capture the next layer rather than the last one. Eight parts, twenty-six chapters, eighteen figures and the PAS / AIMS / ANCI framework family. Free, and readable in full on this page.
 ₹4,900
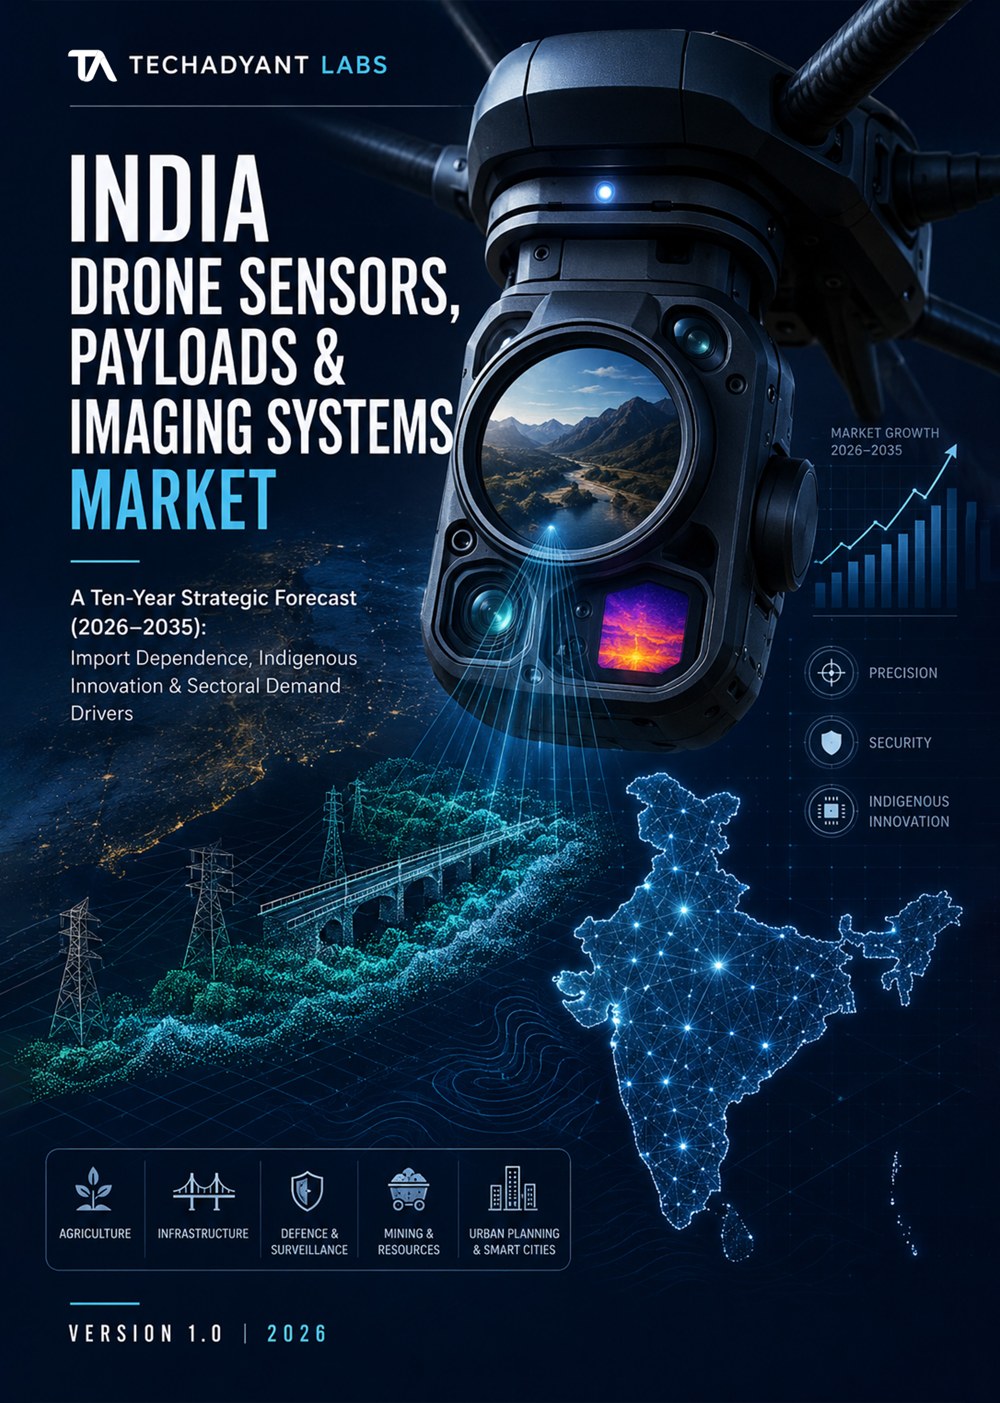
India Drone Sensors, Payloads & Imaging Systems Market
Market Size, Segmentation, Supply-Chain Dependence and 2026–2035 Forecast for the Sensing Layer Inside India’s DronesA drone is only as capable as what it can sense, and India imports most of that capability. The market for drone sensors, payloads and imaging systems is valued at roughly US$190–210 million in 2026 and modelled to reach US$1.1–1.5 billion by 2035 at a 22–26% CAGR — but 70–80% of high-grade sensor demand is met by imports: LiDAR is about 85% imported, thermal about 80%, and inertial measurement units about 70%, sourced mainly from China, Taiwan and the United States. This report sizes the market segment by segment (sensor type, end-use sector, UAV class, component tier and region), maps the import-dependence and localisation roadmap, profiles the competitive landscape — ideaForge, Eon Space Labs, Garuda Aerospace, BEL and the international suppliers — and runs a ten-year forecast across three scenarios. It tracks the structural shifts now reshaping value capture: the move from discrete sensors to integrated, pre-calibrated payloads, the rise of Drone-as-a-Service and data monetisation over hardware, and indigenous breakthroughs such as Eon Space Labs’ germanium-free thermal imaging that cuts system cost 60–70%. Thirteen chapters, 50 figures, 137 tables, and a full segmentation and forecast model.
 ₹4,999
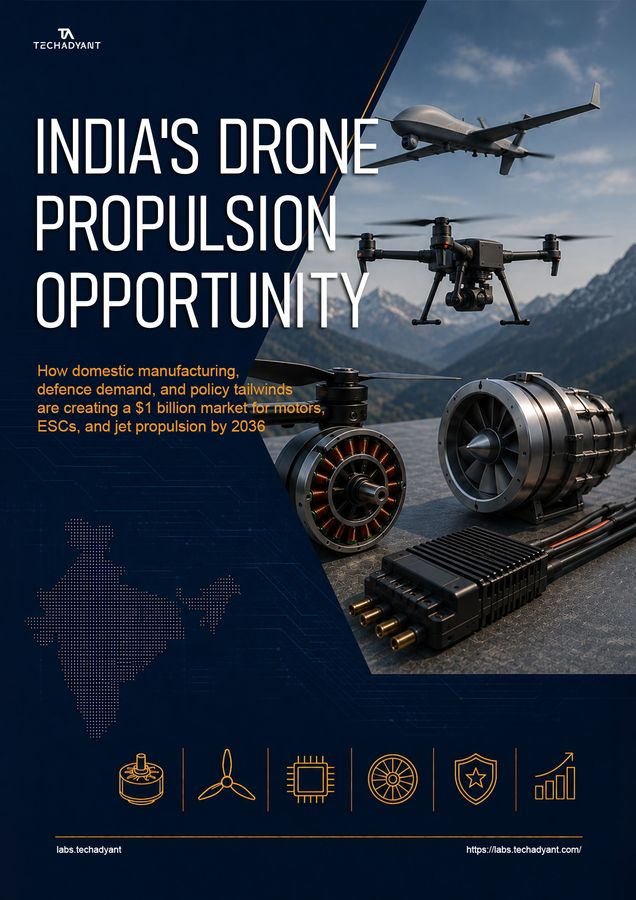
India’s Drone Propulsion Opportunity
How Domestic Manufacturing, Defence Demand and Policy Tailwinds Are Building a $1 Billion Market for Motors, ESCs and Jet Propulsion by 2036India has localised drone assembly faster than almost any advanced-manufacturing sector — drone-component imports fell from over 80% in 2020 to below 40% by 2025 — but the dependency moved upstream rather than disappearing. This report puts the propulsion stack (motors, ESCs, propellers and the emerging jet/hybrid segment) under the lens: a US$95M market in 2025 growing to US$350M by 2030 at a 29.8% CAGR, where motors and ESCs are now assembled in India while the rare-earth magnets and ESC microcontrollers inside them remain 80–100% imported. It maps the supply chain layer by layer, scores margins and the competitive landscape, models defence demand (15,650+ propulsion units to 2030) and landed costs, and runs a ten-year forecast with three scenarios. Fifteen chapters, 45+ figures and tables, and a companion Excel data pack with a 50+ supplier directory and technical-specifications database.
 ₹6,999
India’s Drone Battery Ecosystem
Flight Risk — Securing India’s Drone Battery Ecosystem from Strategic Dependencies to an Industrial OpportunityIndia is building a world-class drone industry on an imported energy core. Of every ₹100 of value an Indian drone OEM earns, more than ₹50 leaves the country for a concentrated, overwhelmingly Chinese, battery supply chain; India scores just 30/100 on the Drone Battery Sovereignty Index. The report maps the dependency layer by layer, quantifies the ~US$10.8bn opportunity by 2030, and shows why the fastest route to value is the intelligent layer — BMS, analytics, certification and recycling — where capture jumps from ~5% to 35–40% without first solving cell manufacturing. Two proprietary frameworks (the DBSI and the five-level Readiness Model), thirty-plus figures, a ten-chart CXO dashboard, four 2035 scenarios, six appendices and a companion Excel data pack.
 ₹6,999
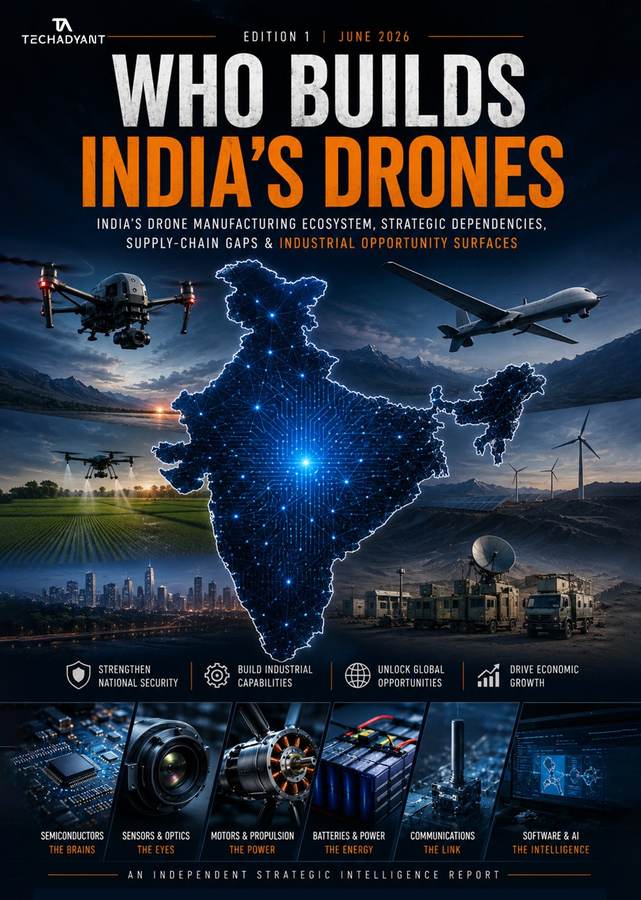
Who Builds India’s Drones?
India’s Drone Manufacturing Ecosystem — Strategic Dependencies, Supply-Chain Gaps, and the Opportunity Surfaces Beyond AssemblyIndia has built a drone assembly industry, not a drone manufacturing one — and its own customs data prove it: in FY2025-26 India imported about US$8 million of finished drones but roughly US$767 million of drone and aircraft parts. The 2022 import ban relocated the dependency upstream rather than removing it, into the rare-earth magnets, lithium-ion cells and flight-controller silicon that are 78–90% Chinese. This report maps that dependency layer by layer, scores 100 opportunity surfaces and 50 components on six proprietary frameworks (DLI, DSCDM, DCS, DIRM, DCRI, DOSF), quantifies the value India leaves on the table (≈43% captured today, ≈66% achievable — a reshoring prize of ~US$1.1bn a year by 2030), and sets out a selective-sovereignty path to 2035. Thirteen chapters, sixteen figures, a 100-opportunity registry, a 50-component Drone Sovereignty Index and thirteen reference appendices.
 ₹6,999
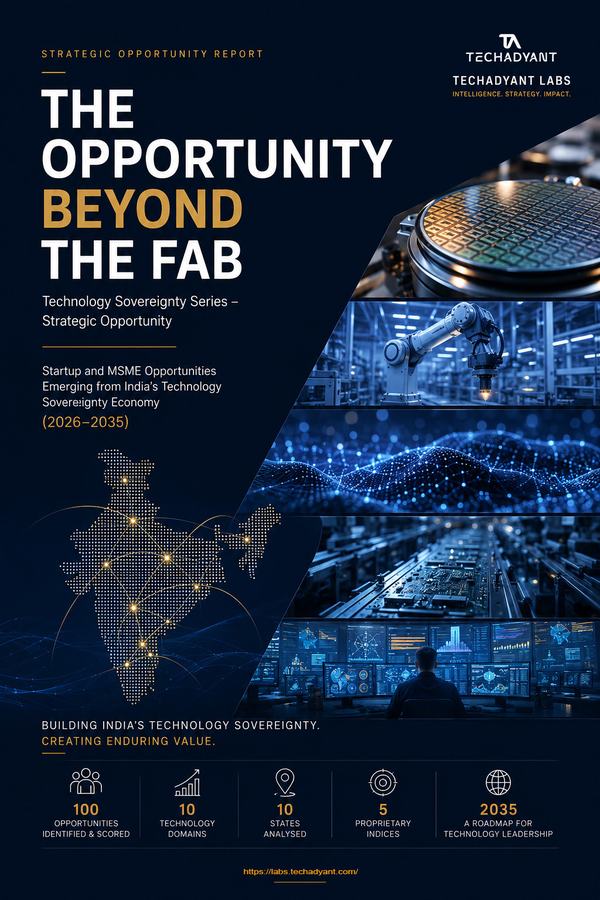
The Opportunity Beyond the Fab
Startup and MSME Opportunities Emerging from India’s Technology Sovereignty Economy (2026–2035)India has committed roughly ₹1.6 lakh crore to semiconductor manufacturing — thirteen projects across seven states. The fab gets the headlines, but it is the visible peak of a ten-layer industrial pyramid, and the layers around it are where most of the capturable value sits and where India’s existing MSME and talent base can actually compete. This report identifies, scores and ranks 100 startup and MSME opportunities across the full technology-sovereignty stack — materials, precision components, industrial software, AI, engineering software, cybersecurity and export — using five proprietary frameworks (TOMI, TSVI, IRR, GEM, SOE). 144 pages, 43 figures, 100 one-page scorecards, 10 state dashboards, a master opportunity map. The opportunity is around the fab, not instead of it.
 Free
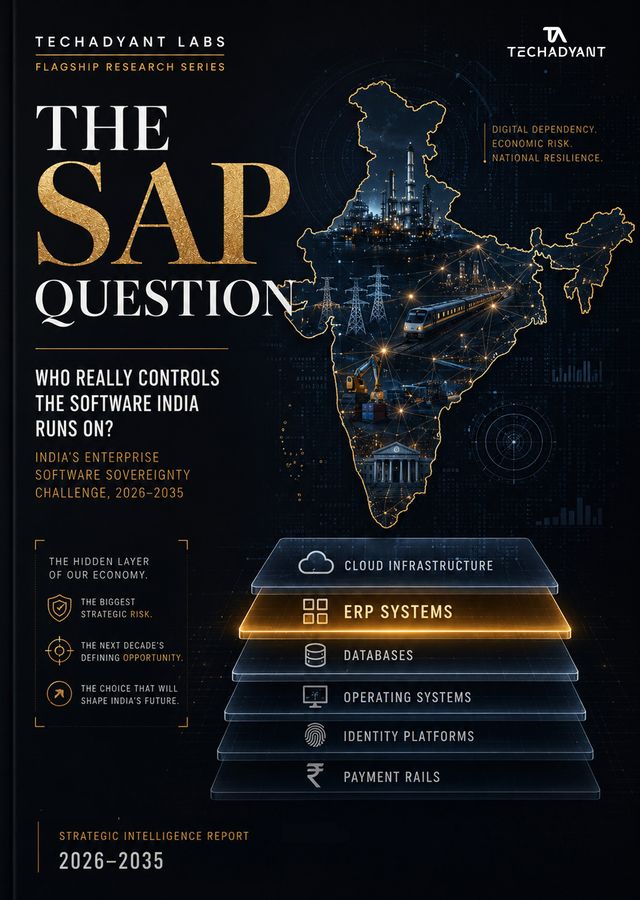
FreeThe SAP Question
India’s Enterprise Technology Sovereignty Report 2026–2035 — Who Really Controls the Software India Runs On?India built the world’s software workforce but imports the enterprise software its own economy runs on. More than 5,000 enterprises — the operational core of ONGC, IndianOil, NTPC, BHEL, SAIL, the PSU banks and the armed forces — run on foreign ERP. This report measures the dependency layer by layer with three proprietary frameworks (EDI, SSS, DIEM), maps where SAP runs India sector by sector, weighs it against Germany, China, South Korea and France, sets out the 2027 SAP deadline and the AI reset, and charts the sovereign-software opportunity to 2035. ~180 pages, 30+ figures, 21 data tables, eight appendices. Free.
 Free
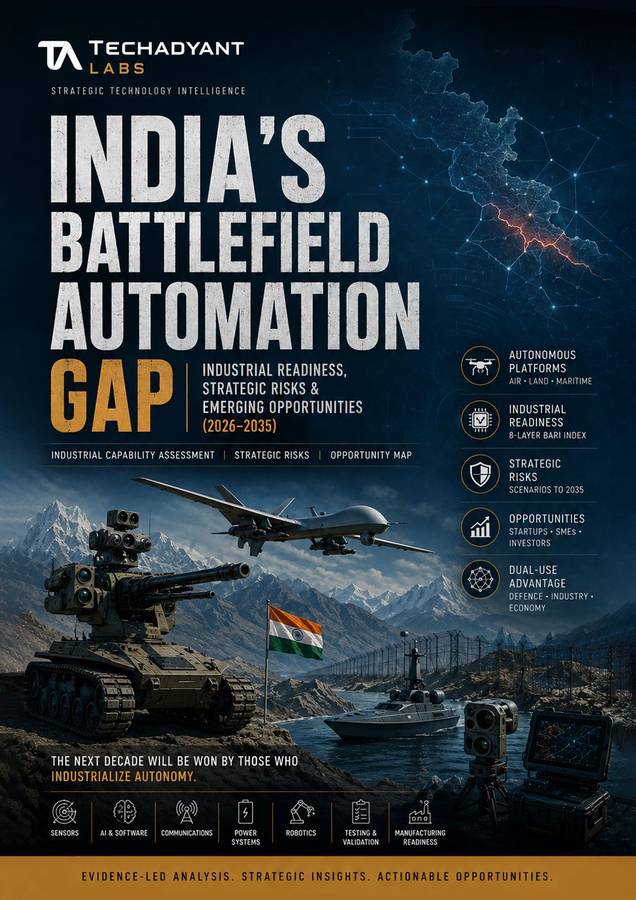
FreeIndia’s Battlefield Automation Gap
Industrial Readiness, Strategic Risks & Emerging Opportunities (2026–2035)Battlefield automation is an industrial-capability race, not a procurement race. Using a proprietary Battlefield Automation Readiness Index (BARI), this report scores India against China and the United States across eight industrial layers — sensors, rugged electronics, batteries, tactical communications, autonomy software, testing and manufacturing — maps where the gap concentrates, reads it sector by sector, and identifies the startup, SME and policy opportunities that would close it. Published free, given its relevance to government-led initiatives.
 ₹4,900
Who Actually Captures the India–US Minerals Alliance?
Why Separation and Magnets — Not Mines — Decide India’s Place in the Hardware CenturyThe 26 May 2026 India–US critical-minerals framework is read as a mining deal. It is better understood as a midstream deal: the leverage sits in separation, refining and magnets — roughly 85–92% controlled by China — not in reserves. Using a proprietary four-chokepoint framework, this report scores India sector by sector — semiconductors, electronics, defence, EVs, energy and AI infrastructure — and asks who actually captures the value as the alliance moves from signature to execution.
 Free
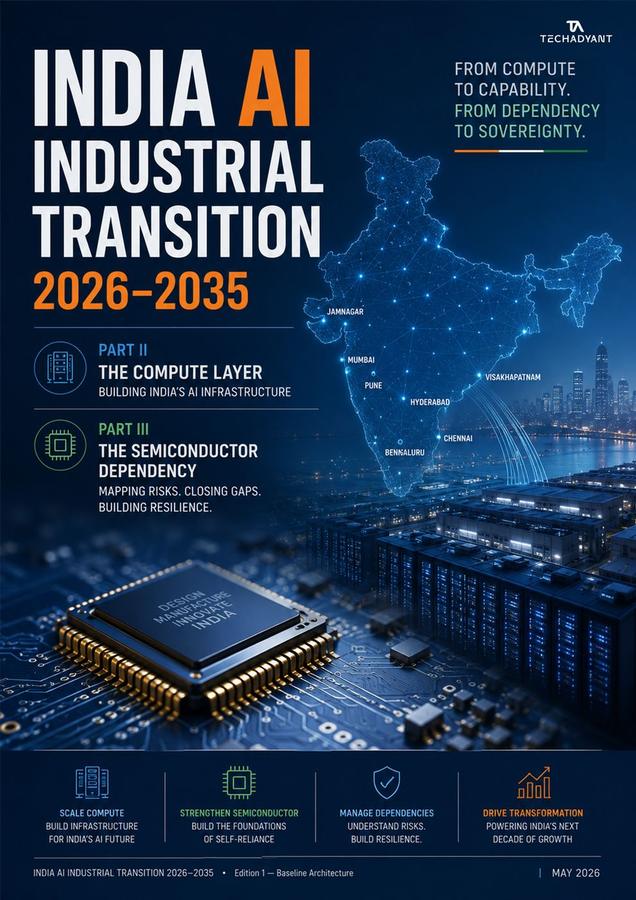
FreeIndia’s AI Industrial Transition and Infrastructure Transformation
A strategic-intelligence map of compute, semiconductors, power, water, regional corridors, and the second-order industrial reshaping of IndiaA baseline architecture for India’s 2026–2035 AI industrial transition: ten anchor numbers, six theses, nine analytical frameworks, seven regional corridors, three scenarios, and eight failure-mode stress tests. The transition is treated as a re-layering of compute, semiconductors, power, water, fibre, real-estate and skilled labour — not as a workforce or careers story.
 ₹4,900
Who Really Benefits from India’s Fab Ecosystem?
The Hidden Industrial Transformation Behind India’s Semiconductor MissionIndia’s semiconductor push is usually told as a story about chips. It is better understood as a story about land, water, power, packaging and people — and about who captures the value when a state decides to manufacture its way up the technology stack.
Tell us the report or sector you need. We publish based on what our readers are actually trying to decide — every request goes into our research pipeline.