
Solar & Clean-Energy Manufacturing
Techadyant Labs research on solar & clean-energy manufacturing in India — the dependencies, constraints and opportunity surfaces that decide the real outcome. 2 published reports.
 ₹4,900
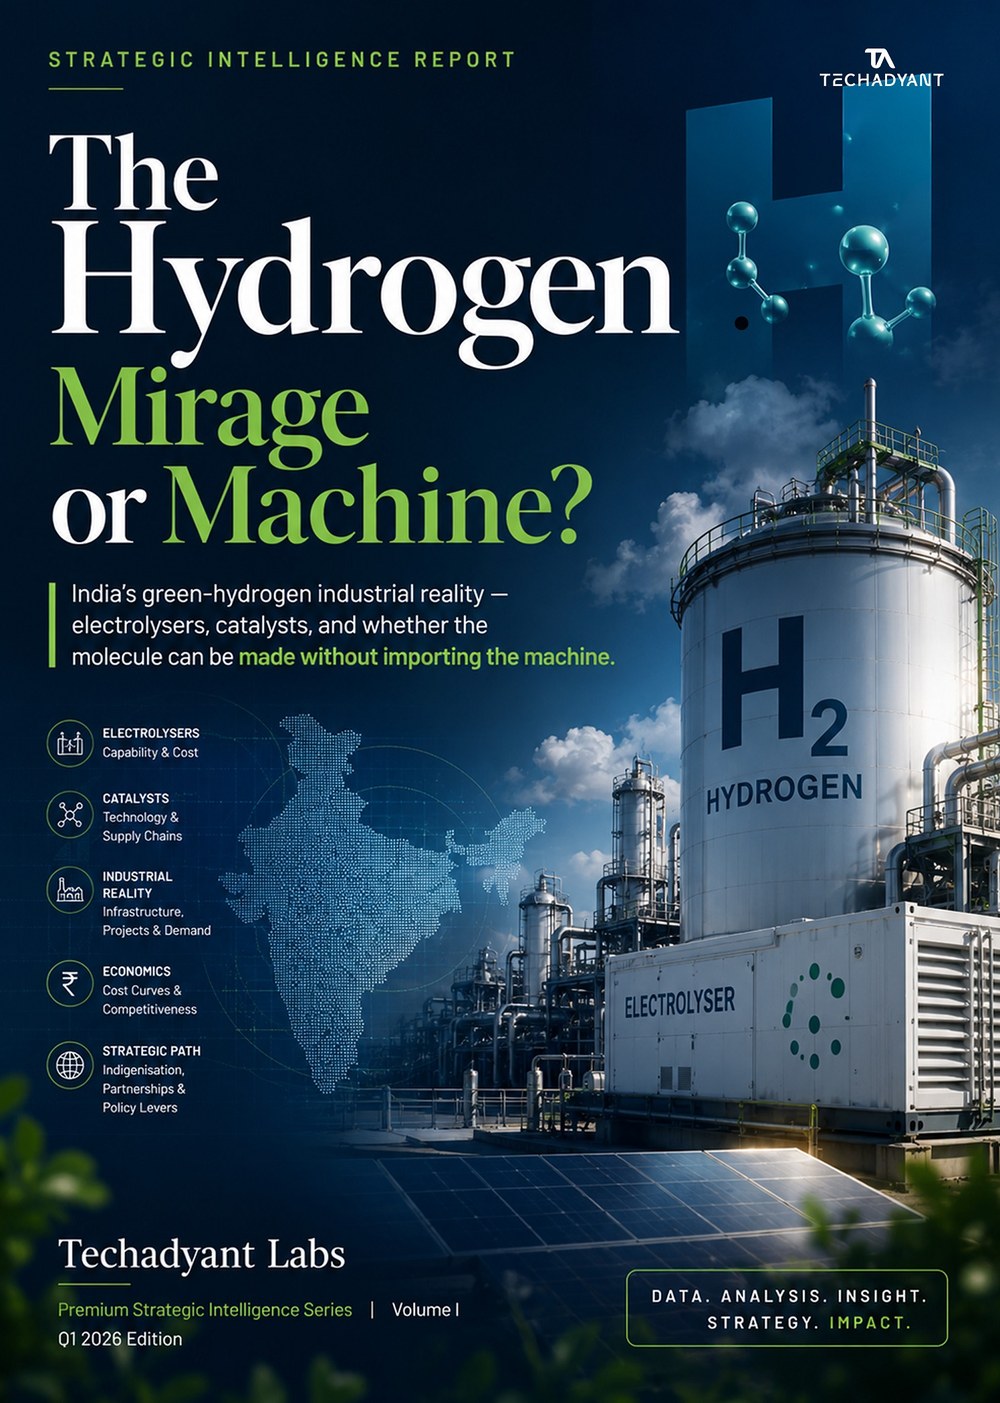
The Hydrogen Mirage or Machine?
India’s green-hydrogen industrial reality — electrolysers, catalysts, and whether the molecule can be made without importing the machine.Green hydrogen has moved in thirty months from the margins of Indian energy policy to its centre: the National Green Hydrogen Mission committed ₹19,744 crore in January 2023, and the SIGHT scheme (₹17,490 crore — about ₹4,440 crore for electrolyser manufacturing and ~₹13,050 crore for production) targets 5 MMT of green hydrogen and 60 GW of electrolysers by 2030. This strategic-intelligence report argues India has built its policy around the molecule but not the machine. Green hydrogen is a molecule; the electrolyser is the machine that makes it — and the machine depends on catalysts (iridium and platinum, of which India produces zero), PFSA membranes (IP held by three Western firms), and critical materials India barely processes. India’s effective electrolyser output is under 1 GW against China’s ~45 GW, and China holds ~60% of global manufacturing capacity. Across eighteen chapters the report maps the six supply-side vulnerabilities, the LCOH economics, the SIGHT programme, demand across refining/steel/fertiliser, the strategic control points, and three 2035 scenarios — Mirage, Muddle or Machine — with the base case (Muddle) missing the 5 MMT target by ~30%. Fifty-plus data tables, ~24 figures, and a companion data workbook.
 ₹6,999
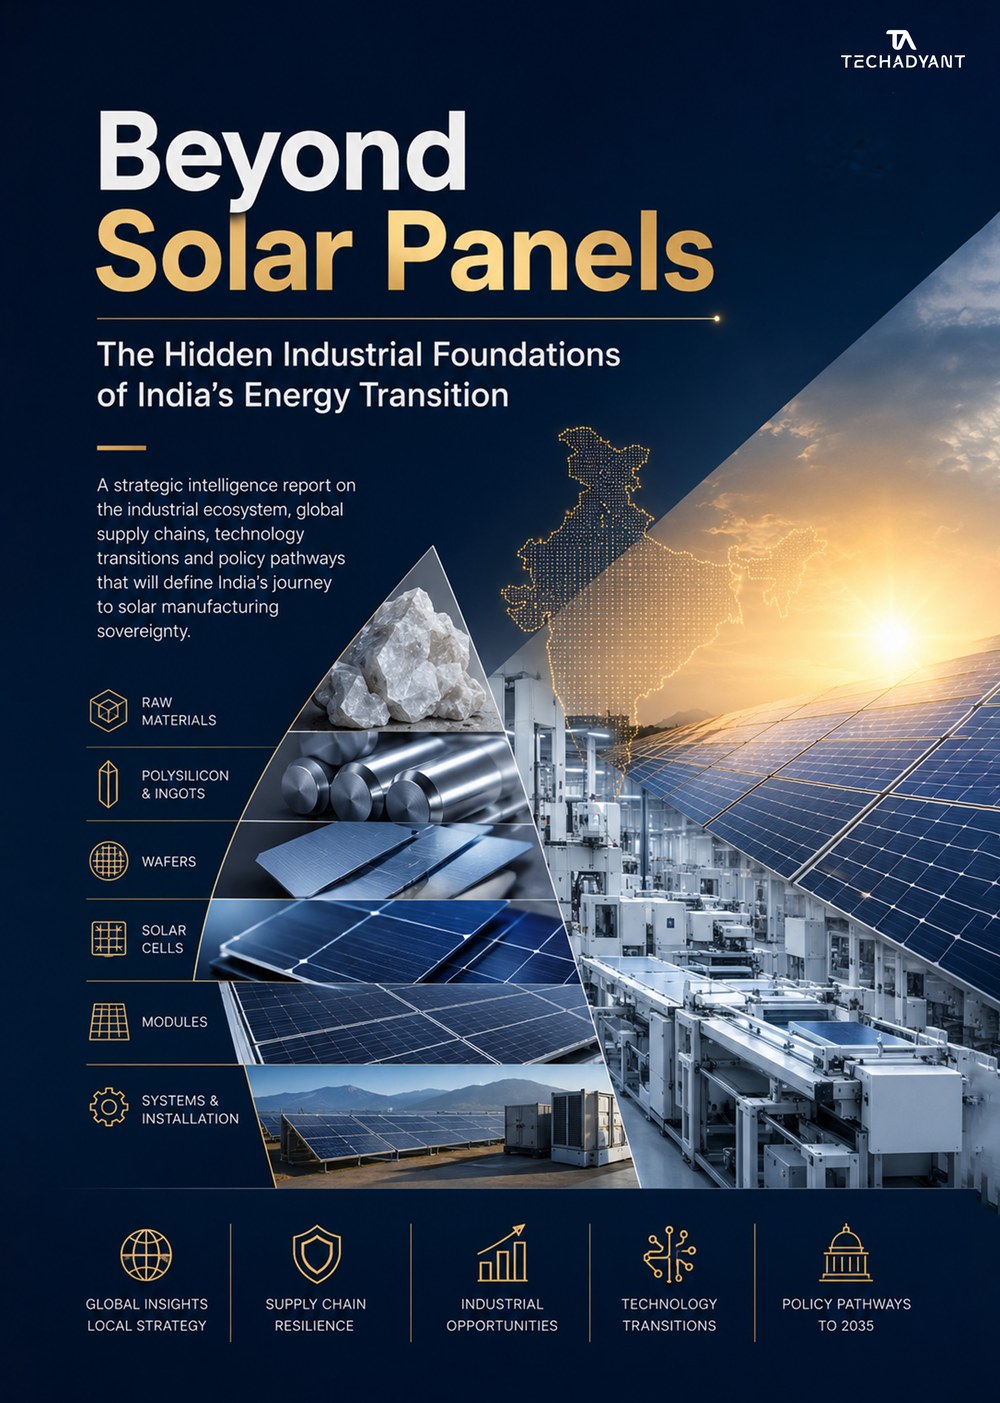
Beyond Solar Panels
India built the world’s largest solar-deployment machine — but value and vulnerability live upstream of the panel. Mapping the hidden industrial stack: polysilicon, wafers, cells, glass, gases, chemicals and manufacturing equipment.India has built one of the world’s largest solar-deployment machines — 162.15 GW of installed solar capacity by 30 June 2026 (MNRE), against a 2030 objective of 280 GW of solar within 500 GW of non-fossil capacity. But deployment has outrun manufacturing depth. This report reframes the question away from module assembly toward the industrial system beneath it: capability inverts value across the stack — India is strongest downstream in modules (~172 GW of ALMM-listed capacity) and materially weaker upstream in cells, wafers, polysilicon, specialty chemicals, industrial gases, solar glass and production equipment, where China holds roughly 85% of solar supply-chain capacity and about 95% of wafer capacity (IEA 2026). Across thirteen chapters it maps the manufacturing stack, the hidden material and equipment foundations, localisation economics, the industrial opportunity surfaces, state-level clusters, technology transitions and a roadmap to solar-manufacturing sovereignty — with an investment-intelligence playbook. Fifty-three tables, twenty-two figures and seven appendices; a companion data workbook is available with the data tier.
Saatvik Green Energy has won a Rs 1,041.63 crore order from SECI to supply about 600 MWp of solar modules, with execution scheduled by December 2027. The signal is not the headline size but the direction: state-backed offtake is loading India domestic module and cell capacity.
Premier Energies has commissioned a 7 GW solar cell facility in Andhra Pradesh - described as India''s largest - taking its total cell capacity to about 10.6 GW at a project cost of roughly Rs 3,293 crore. Cell manufacturing, not module assembly, is the import-dependent layer India has long bought from China; a domestic 7 GW cell line is a real move down the solar stack, though wafers and polysilicon upstream remain the deeper dependency.
Maruti Suzuki has commissioned a 300 kW green-hydrogen electrolyser pilot at its Manesar plant - its first - producing hydrogen from renewable power for captive use. It is a real step into electrolysis, but at 300 kW it is a demonstration, not industrial scale; the strategic questions are electrolyser localisation and whether captive pilots scale into the GW-class green-hydrogen capacity India''s targets assume.
The foundation stone has been laid for India''s first port-based e-methanol plant at Deendayal Port (Kandla) - a Rs 2,300 crore, 150 TPD joint venture between the port authority and Assam Petro-Chemicals, using renewable power, water and biogenic CO2 to make green marine fuel for the Asia-Europe corridor. Maritime fuel is a hard dependency layer for trade and defence logistics; siting green-fuel production at the port where ships already stop is a real move, but a foundation stone is not operating capacity.
Map this ecosystem
See where India stands across the value chain — players, dependencies and scores — in the free Atlas.