
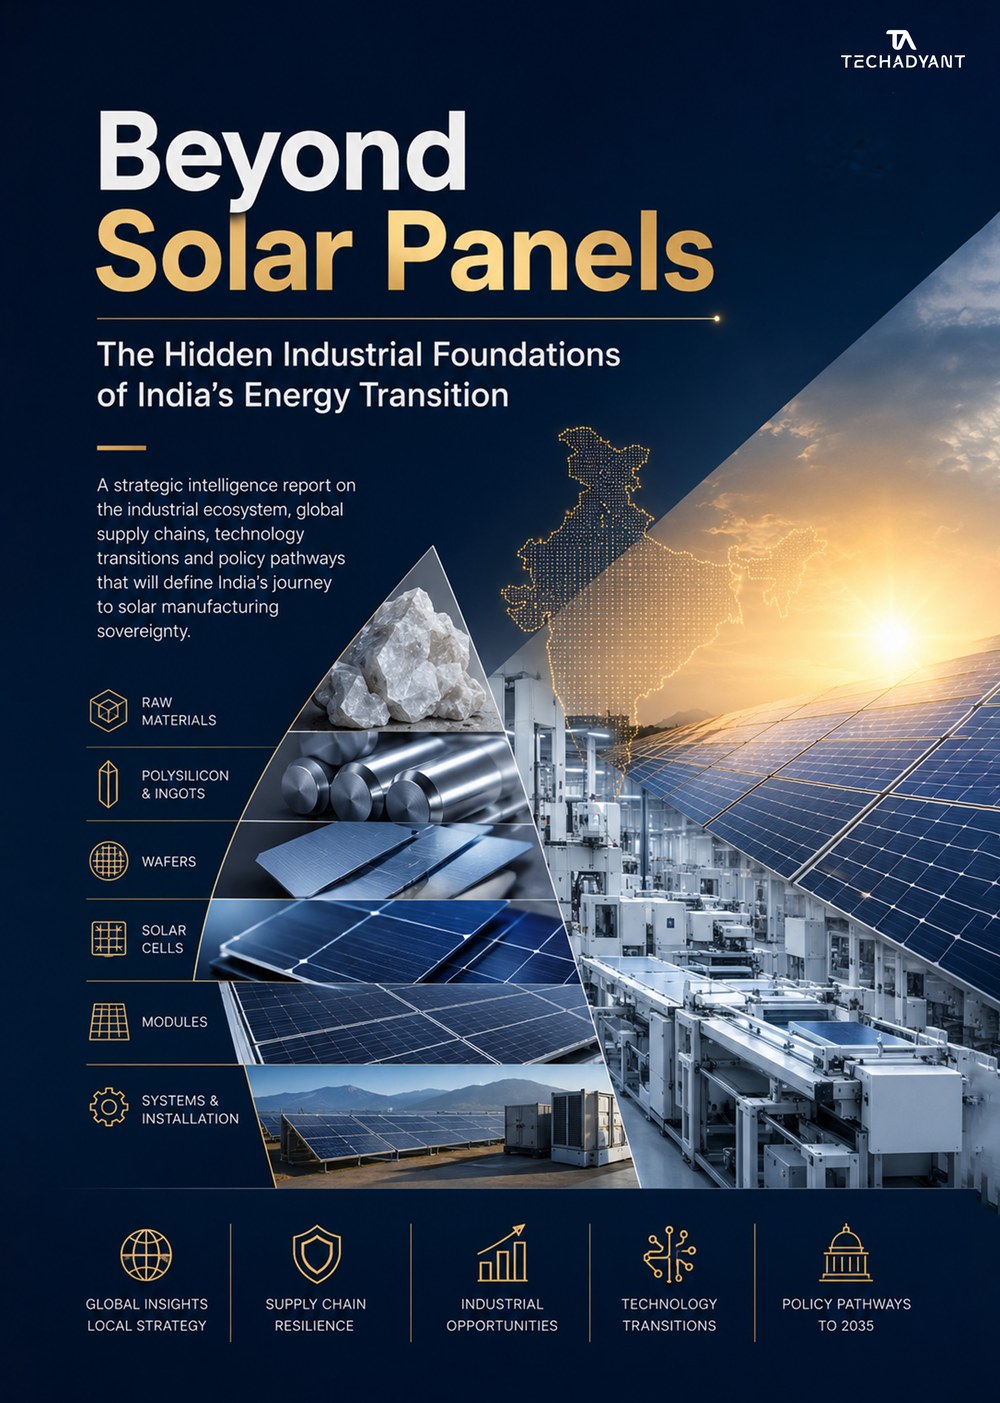
The value is above the panel
India has built one of the world's largest solar-deployment machines — 162.15 GW of installed solar capacity by 30 June 2026, against a national objective of 280 GW of solar within 500 GW of non-fossil capacity by 2030. But deployment has advanced faster than manufacturing depth. The solar module is the visible, final-assembly layer of a much larger industrial system: beneath every module lie polysilicon production, ingot pulling, wafer slicing, cells, specialty chemicals, industrial gases, solar glass and the manufacturing equipment that makes all of it. This report reframes the question away from “how many gigawatts of modules” toward the industrial stack beneath the panel — where the value, and the vulnerability, actually sit.
Capability inverts up the stack
India's manufacturing base is strongest exactly where value is thinnest. Module-assembly capacity has scaled rapidly — around 172 GW of ALMM-listed capacity — but that is an approval-and-listing measure, not proof of equivalent operational output or domestic value addition. Move up the stack and capability falls away: cells, wafers, polysilicon, specialty materials and production equipment remain materially weaker. The report treats listed capacity, operational capacity and value addition as distinct, and shows how the arithmetic of the inversion is scenario-dependent — the component-share and value-leakage figures are Techadyant's illustrative 2026 model for a specified module configuration, not universal industry constants.
China's structural dominance
The reason the upstream layers are hard is that they are already owned. The IEA's 2026 estimates place China at roughly 85% of solar supply-chain production capacity and about 95% of PV wafer capacity. That dominance is structural, not incidental — the product of two decades of coordinated capacity build-out, and deepest in precisely the polysilicon, wafer and equipment layers India most needs to localise. The report distinguishes capacity from output and dates every company-level figure, so the dependence is measured, not asserted.
Where India can build
The opportunity is not to replicate China layer-for-layer but to build defensible depth where India has cross-over advantages and where a supply shock would hurt most. The report ranks industrial opportunity surfaces across the stack — upstream materials (polysilicon, wafers, specialty chemicals, industrial gases, solar glass), cells, and manufacturing equipment — with localisation economics, state-level clusters and an investment-intelligence playbook. Each surface is assessed for strategic value, localisation potential and the policy and capital it needs, so a builder or investor can see which layers are open now and which require the ecosystem to mature first.
A roadmap to sovereignty
Solar-manufacturing sovereignty is a sequencing problem, not a slogan. The report sets out a phased roadmap that pairs the demand pull (deployment targets, ALMM, the PLI tranches — Tranche I ₹4,500 crore / 8,737 MW and Tranche II ₹19,500 crore / 39,600 MW — and the 2025 duty structure) with the supply-side build-out of cells, wafers, polysilicon, materials and equipment. It closes with a boardroom playbook and strategic recommendations for manufacturers, investors, state governments and policymakers.
What the full report adds
The full ~144-page edition carries all thirteen chapters: the anatomy of the solar manufacturing stack; the hidden material and equipment foundations; China's solar machine; India's ecosystem; localisation economics; the industrial opportunity surfaces; state-level opportunity mapping; future technologies and transitions; supply-chain resilience and risk scenarios; the roadmap to sovereignty; and an investment-intelligence and boardroom playbook. Fifty-three tables, twenty-two figures and seven appendices (global polysilicon and wafer producers, the India manufacturing database, the equipment landscape, glass/gas/chemical ecosystems and state profiles), plus a companion data workbook available with the data tier.
Unlock the complete report
You’re reading the free preview. The full analysis continues with six more sections and the downloadable PDF edition.
- 🔒04 · Water, power & land
- 🔒05 · The packaging layer
- 🔒06 · Who captures the value
- 🔒07 · The talent constraint
- 🔒08 · Second-order effects
- 🔒09 · What to watch · references
You’ll be asked to sign in, then complete a one-time secure purchase.