
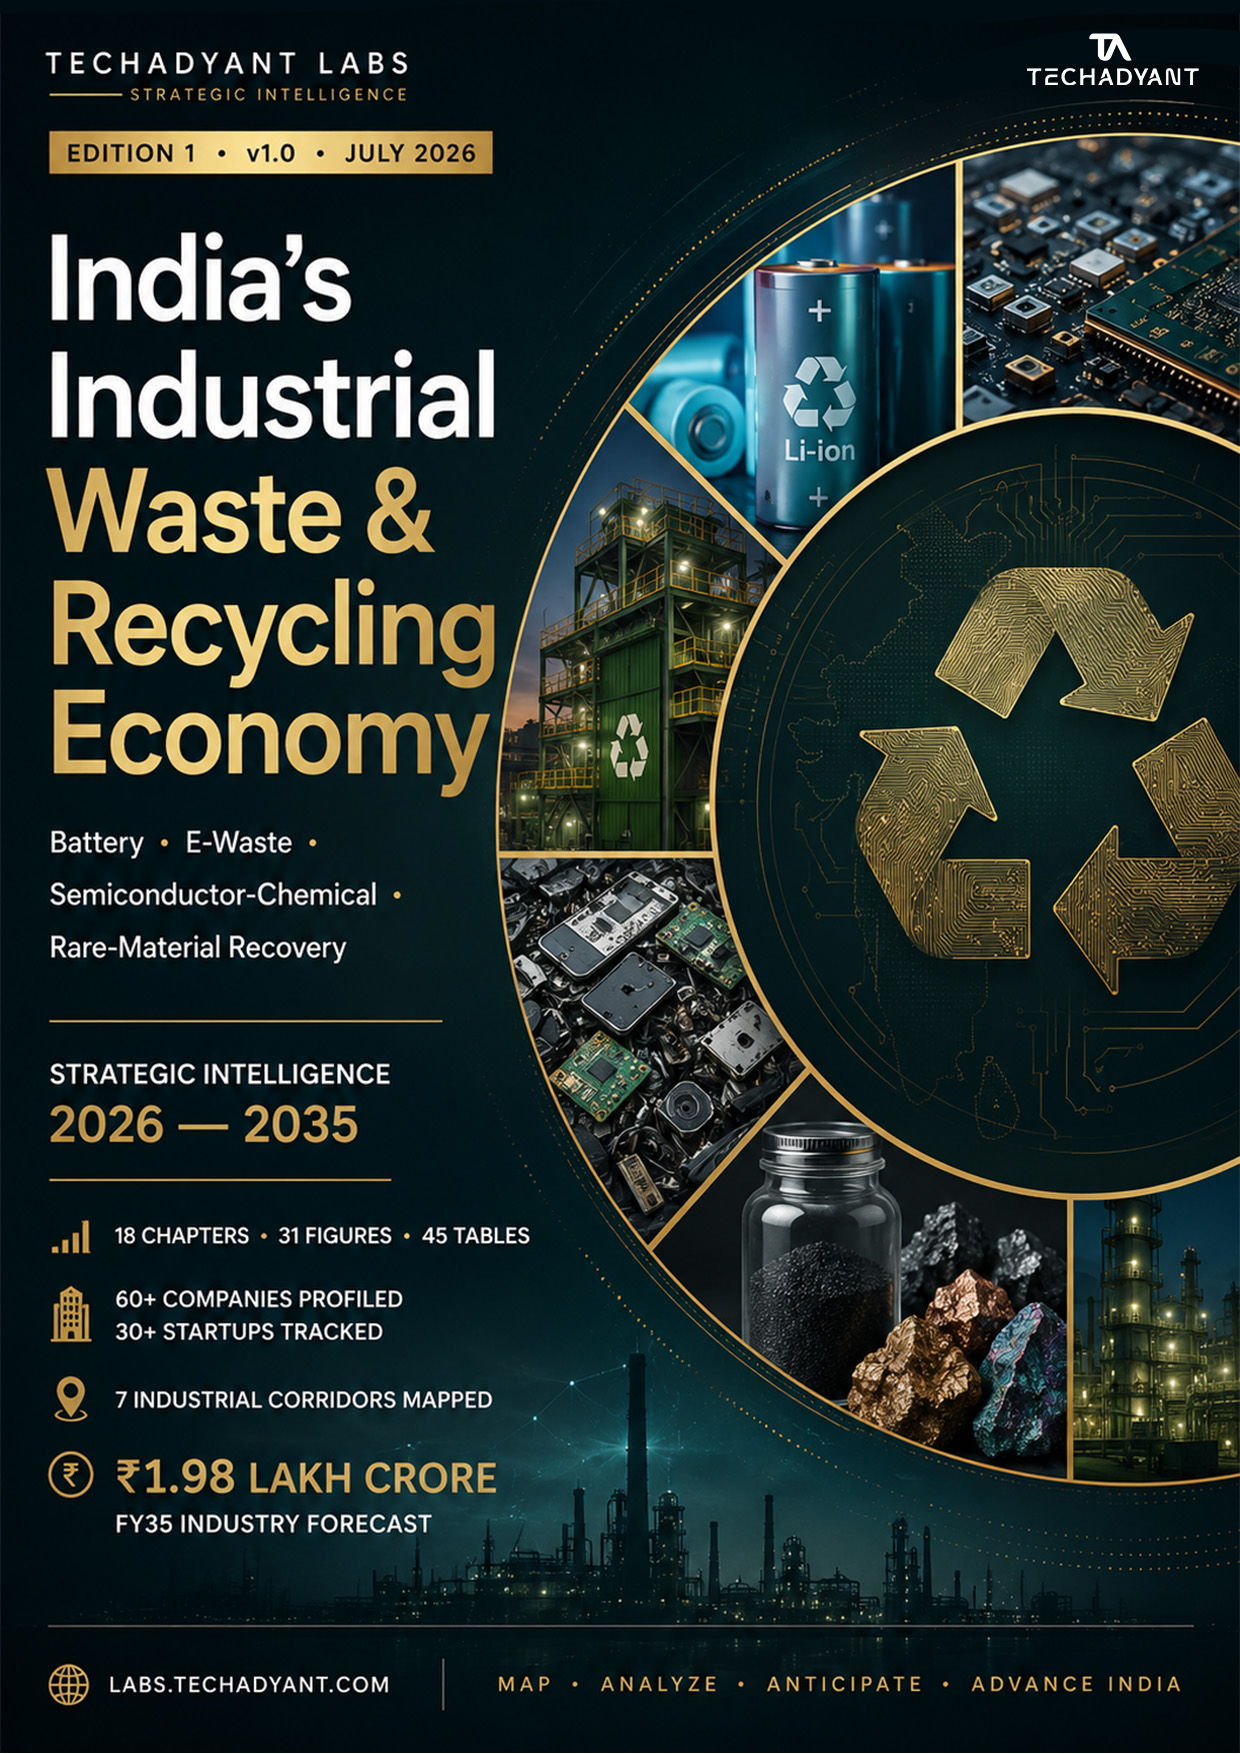
India is sitting on one of the world’s largest untapped industrial recycling economies, but most of it is still treated as waste rather than feedstock. This report maps the recovery opportunity across battery metals, e-waste, industrial chemicals and critical minerals, and sizes the revenue, margin and capability stack for the decade ahead.
- The recycling economy already encompasses battery metals, e-waste, chemical recovery and critical-minerals loops that are still largely export-led or informal-sector-dependent.
- Black mass, lithium,cobalt/nickel recovery, PCB fractions andsemiconductor-grade chemical recycling are the highest-value opportunity surfaces.
- The ten-year addressable opportunity across mapped segments is modelled in the ₹18,000–35,000 crore band, with the fastest path through battery-recycling clusters, e-waste urban mines and industrial-chemical recovery corridors.
- Policy support is strengthening through Battery Rules, E-Waste Rules, PLI-like recycling incentivesand state-level industrial clusters, but implementation, formalisation and technology depth remain uneven.
- The competitive advantage will belong to operators who can demonstrate verified recovery yields, traceable feedstockand scalable secondary-refining capability, not just collection volume.
Recycling as an industrial base
The recycling economy is often framed as an environmental compliance story. The stronger frame is industrial strategy: India is importing the same critical materials it is simultaneously throwing away, and the gap between waste stream composition and refining capability is where the next industrial playbook is being written. Battery metals, printed-circuit-board fractions, specialty chemicals and critical-minerals residues are all feedstock for a secondary industrial base that does not yet exist at scale.
Market size and trajectory
The report models the recyclable-metal, chemical-recovery and e-waste-processing markets across three scenarios. The addressable opportunity is not uniform: battery metals, lithium-ion recycling and high-value PCB fractions show faster monetisation than bulky plastics recovery or low-grade ferrous scrap. Revenue is weighted toward refined chemicals and metals rather than collection.

Materials flow and recovery
Battery waste, end-of-life electronics, industrial process residues and end-of-life solar and wind assets are creating a complex multi-material stream. The report decomposes the flow into recoverable fractions: lithium, cobalt, nickel, manganese, copper, aluminium, gold, silver, palladium, rare-earth magnets, silicon, glass and polymers. Recovery economics vary sharply by collection quality, sorting technology and downstream refining capability.

Energy and chemicals recovery
Beyond metals, the recycling economy has a large energy and chemicals layer. Waste oils, solvents, acids, alkalis and process chemicals can be recovered, purified and reintroduced into industrial supply chains. The report maps the segments where recovery yields are high enough to justify closed-loop infrastructure and where contaminant profiles make reuse economically attractive.

Import dependence
India imports a large share of the specialty chemicals, refined metals and advanced materials that its recycling economy could supply domestically. The report maps import dependence in lithium hydroxide, cobalt salts, nickel sulphate, copper cathodes, high-purity acids, electronic-grade solvents and critical-minerals intermediates, and shows how secondary recovery can reduce exposure.

Business models
The dominant models are aggregator-led informal collection, formal producer-led take-back, contract-chemical recovery for industrial parks, and integrated recycling-refining clusters. Margins are higher in refining and chemicals recovery than in collection or mechanical processing. The report assesses each model against capital intensity, regulatory risk, feedstock security and scalability.
Who leads
Domestic players are active in battery recycling, e-waste processing and industrial waste management, but few operate at the scale or technical depth required for secondary refining of critical materials. International best practice is concentrated in Europe, China and Japan, where policy has forced higher formal collection rates and where advanced hydrometallurgical and direct-recycling processes are closer to commercial maturity.

Corridor opportunity
Recycling infrastructure clusters around industrial corridors, port-adjacent special economic zones and existing renewable-energy and electronics-manufacturing hubs. The report scores seven regional corridors on feedstock density, logistics, regulatory readiness, power and water availability, and proximity to downstream manufacturers who can use recovered materials.

Three phases to 2035
Base case: formalisation rises gradually, recovery rates improve slowly, and most secondary-material value remains in mechanical processing. Accelerated case: policy enforcement, producer-responsibility tightening and targeted recycling clusters push recovery rates higher and unlock refining investment. Constrained case: infrastructure delays, feedstock leakage to unorganised channels and technology bottlenecks keep the sector fragmented and low-margin.

What the full report adds
The full report includes thirty-one figures, twenty-one tables, scenario models, five appendices and a supplier and policy reference framework. It is designed for operators, investors and policymakers who need to move from waste narrative to industrial execution.
Unlock the complete report
You’re reading the free preview. The full analysis continues with six more sections and the downloadable PDF edition.
- 🔒04 · Water, power & land
- 🔒05 · The packaging layer
- 🔒06 · Who captures the value
- 🔒07 · The talent constraint
- 🔒08 · Second-order effects
- 🔒09 · What to watch · references
You’ll be asked to sign in, then complete a one-time secure purchase.